

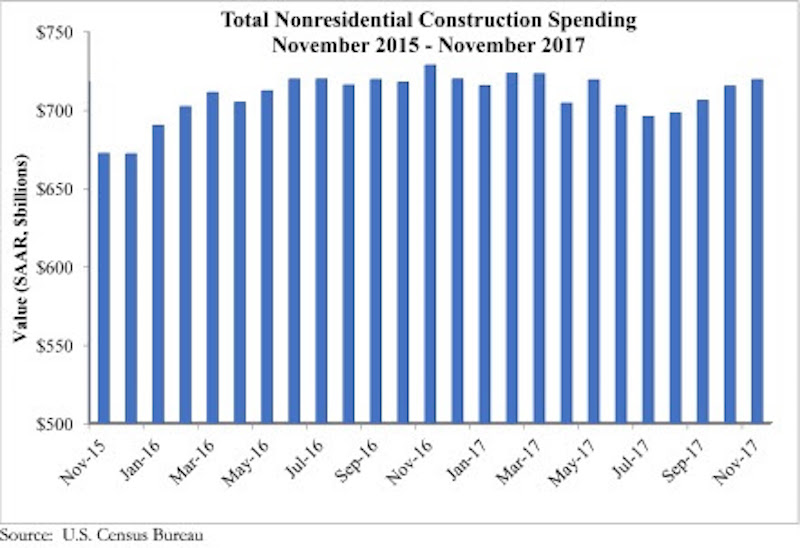
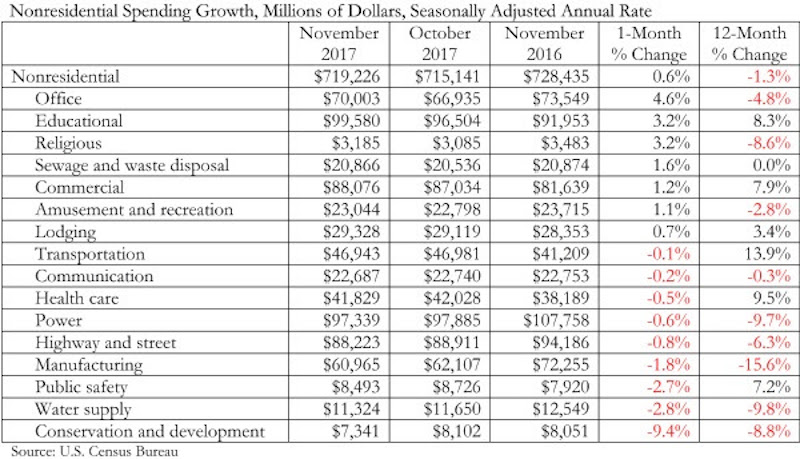
Nonresidential construction spending expanded 0.6 percent in November, totaling $719.2 billion on a seasonally adjusted basis, according to an Associated Builders and Contractors (ABC) analysis of data released today by the U.S. Census Bureau. Despite the month-over-month expansion, nonresidential spending fell 1.3 percent from November 2016.
Private nonresidential construction spending is down 3.1 percent year-over-year, while public sector spending has increased 1.7 percent over the same period. Spending in the manufacturing and power categories, two of the larger nonresidential subsectors, fell by a combined $21.7 billion over the past year.

“The November report represented a stark reversal of preexisting trends,” said ABC Chief Economist Anirban Basu. “For much of the past several years, the pattern in nonresidential construction spending has been one in which a number of private categories expanded briskly, including lodging and office, while a host of public construction categories experienced sluggish spending. That changed in November, with public construction spending rising and private construction spending shrinking on a year-over-year basis.
“There are several possible explanations, including growing concerns about overbuilding in a number of large metropolitan areas in the lodging, office and commercial categories,” said Basu. “Financiers may also be less willing to supply financing to a variety of private projects given such concerns. At the same time, the U.S. housing market is the strongest it has been in at least a decade, raising sales prices and expanding assessable residential tax bases. That in turn has supplied additional resources for infrastructure. Over the past year, this has been particularly apparent in the educational and public safety categories.”
Related Stories

Senior Living Design | May 9, 2017
Designing for a future of limited mobility
There is an accessibility challenge facing the U.S. An estimated 1 in 5 people will be aged 65 or older by 2040.

Industry Research | May 4, 2017
How your AEC firm can go from the shortlist to winning new business
Here are four key lessons to help you close more business.

Engineers | May 3, 2017
At first buoyed by Trump election, U.S. engineers now less optimistic about markets, new survey shows
The first quarter 2017 (Q1/17) of ACEC’s Engineering Business Index (EBI) dipped slightly (0.5 points) to 66.0.

Market Data | May 2, 2017
Nonresidential Spending loses steam after strong start to year
Spending in the segment totaled $708.6 billion on a seasonally adjusted, annualized basis.

Market Data | May 1, 2017
Nonresidential Fixed Investment surges despite sluggish economic in first quarter
Real gross domestic product (GDP) expanded 0.7 percent on a seasonally adjusted annualized rate during the first three months of the year.

Industry Research | Apr 28, 2017
A/E Industry lacks planning, but still spending large on hiring
The average 200-person A/E Firm is spending $200,000 on hiring, and not budgeting at all.

Market Data | Apr 19, 2017
Architecture Billings Index continues to strengthen
Balanced growth results in billings gains in all regions.

Market Data | Apr 13, 2017
2016’s top 10 states for commercial development
Three new states creep into the top 10 while first and second place remain unchanged.

Market Data | Apr 6, 2017
Architecture marketing: 5 tools to measure success
We’ve identified five architecture marketing tools that will help your firm evaluate if it’s on the track to more leads, higher growth, and broader brand visibility.

Market Data | Apr 3, 2017
Public nonresidential construction spending rebounds; overall spending unchanged in February
The segment totaled $701.9 billion on a seasonally adjusted annualized rate for the month, marking the seventh consecutive month in which nonresidential spending sat above the $700 billion threshold.


