

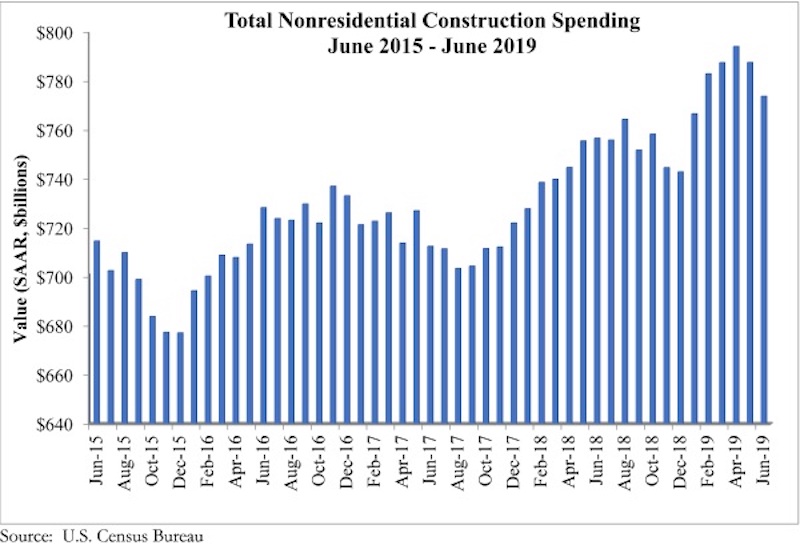
National nonresidential construction spending declined 1.8% in June, totaling $773.8 billion on a seasonally adjusted annualized basis—a 2.3% increase compared to the same time a year ago, according to an Associated Builders and Contractors analysis of U.S. Census Bureau data published today. Public nonresidential spending fell 3.7% in June, but is up 6.4% year over year, while private nonresidential spending fell 0.3% on a monthly basis and is up 0.4% from June 2018.
Among the 16 nonresidential construction spending categories tracked by the Census Bureau, seven experienced increases in monthly spending, although only the conservation and development (+3.8%) and commercial (+1.3%) categories increased by more than 1%. While spending in several categories fell for the month, significant decreases in the publicly driven educational (-6.5%) and highway and street (-6.3%) categories accounted for nearly all of the monthly decline.
“Like the balance of the U.S. economy, nonresidential construction spending appears to be softening, albeit gradually,” said ABC Chief Economist Anirban Basu. “Private nonresidential construction spending has been trending lower for several months, and segments like office and lodging are no longer the drivers of construction spending growth that they had been, likely due to growing concerns about market saturation.
“The dip in public construction may have been merely temporary, which is likely the case given the ongoing strength of state and local government finances.” said Basu. “And with the economy still adding substantial numbers of jobs, wages growing at or near a decade-high pace, consumers continuing to spend and property values remaining stable, local and state governments should continue to experience solid income, retail and real estate tax collections. All things being equal, that should help fuel infrastructure outlays, especially given still very low borrowing costs.
“While many observers continue to focus on issues such as trade disputes, high levels of corporate debt and asset prices that are susceptible to sharp declines, the U.S. construction industry’s most significant source of uncertainty may be the pending insolvency of the Highway Trust Fund,” said Basu. “That insolvency is now a mere two years away, and if policymakers fail to act expeditiously, state and local policymakers may choose to postpone certain projects given the rising uncertainty of federal funding. The highway/street and transportation categories are especially vulnerable to such dynamics.”


Related Stories
Market Data | May 22, 2018
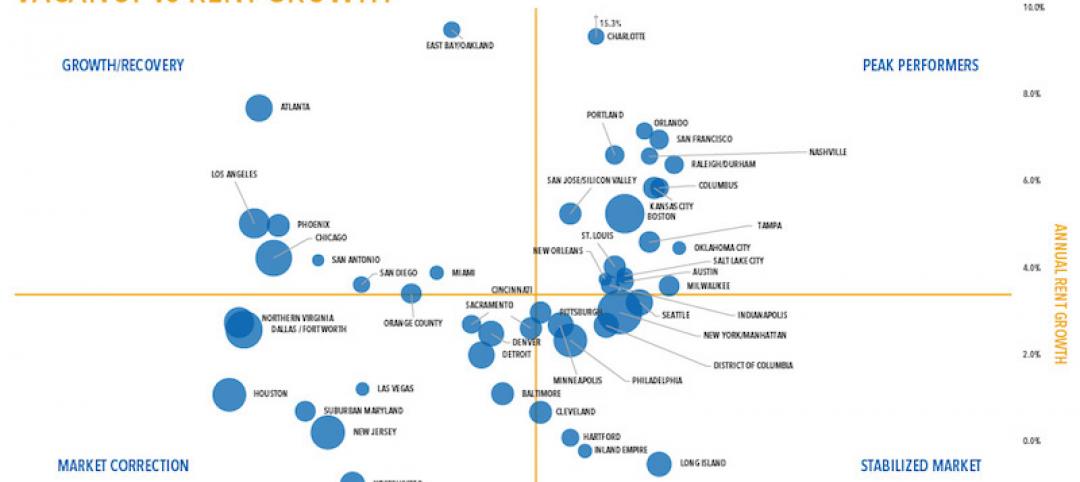
Vacancies stable, rents rising, and pipeline receding, according to Transwestern’s 1Q US Office Market report
The Big Apple still leads the new construction charge.

Market Data | May 18, 2018
Construction employment rises in 38 states and D.C. from April 2017 to April 2018
California & West Virginia have biggest annual job gains, North Dakota has largest decline; California & Louisiana have largest monthly pickup, Indiana & North Dakota lead monthly drops.

High-rise Construction | May 18, 2018
The 100 tallest buildings ever conventionally demolished
The list comes from a recent CTBUH study.

Resiliency | May 17, 2018
Architects brief lawmakers and policy-makers on disaster recovery as hurricane season approaches
Urge senate passage of disaster recovery reform act; Relationship-building with local communities.

Market Data | May 17, 2018
These 25 cities have the highest urban infill development potential
The results stem from a COMMERCIALCafé study.

Market Data | May 10, 2018
Construction costs surge in April as new tariffs and other trade measures lead to significant increases in materials prices
Association officials warn that the new tariffs and resulting price spikes have the potential to undermine benefits of tax and regulatory reform, urge administration to reconsider.

Market Data | May 7, 2018
Construction employers add 17,000 jobs in April and 257,000 for the year
Unemployment rate for construction increases slightly compared to year earlier as higher pay levels appears to be attracting people with recent construction experience back into the workforce.

Market Data | May 2, 2018
Construction employment increases in 245 metro areas between March 2017 & 2018, as trade fights & infrastructure funding shortfalls loom
Houston-The Woodlands-Sugar Land, Texas and Weirton-Steubenville, W.Va.-Ohio experience largest year-over-year gains; Baton Rouge, La. and Auburn-Opelika, Ala. have biggest annual declines.
Market Data | May 2, 2018
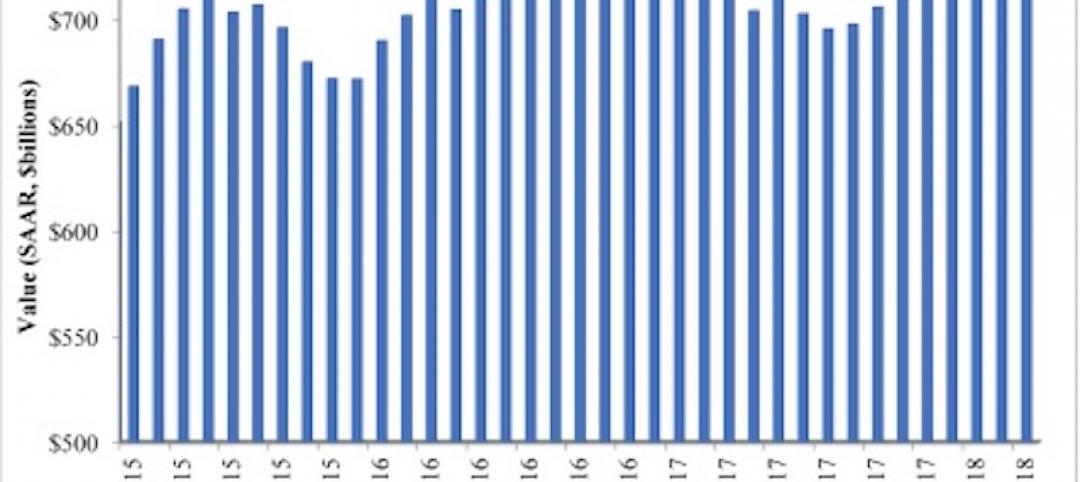
Nonresidential Construction down in March, private sector falters, public sector unchanged
February’s spending estimate was revised roughly $10 billion higher.

Market Data | Apr 30, 2018
Outlook mixed for renewable energy installations in Middle East and Africa region
Several major MEA countries are actively supporting the growth of renewable energy.


