


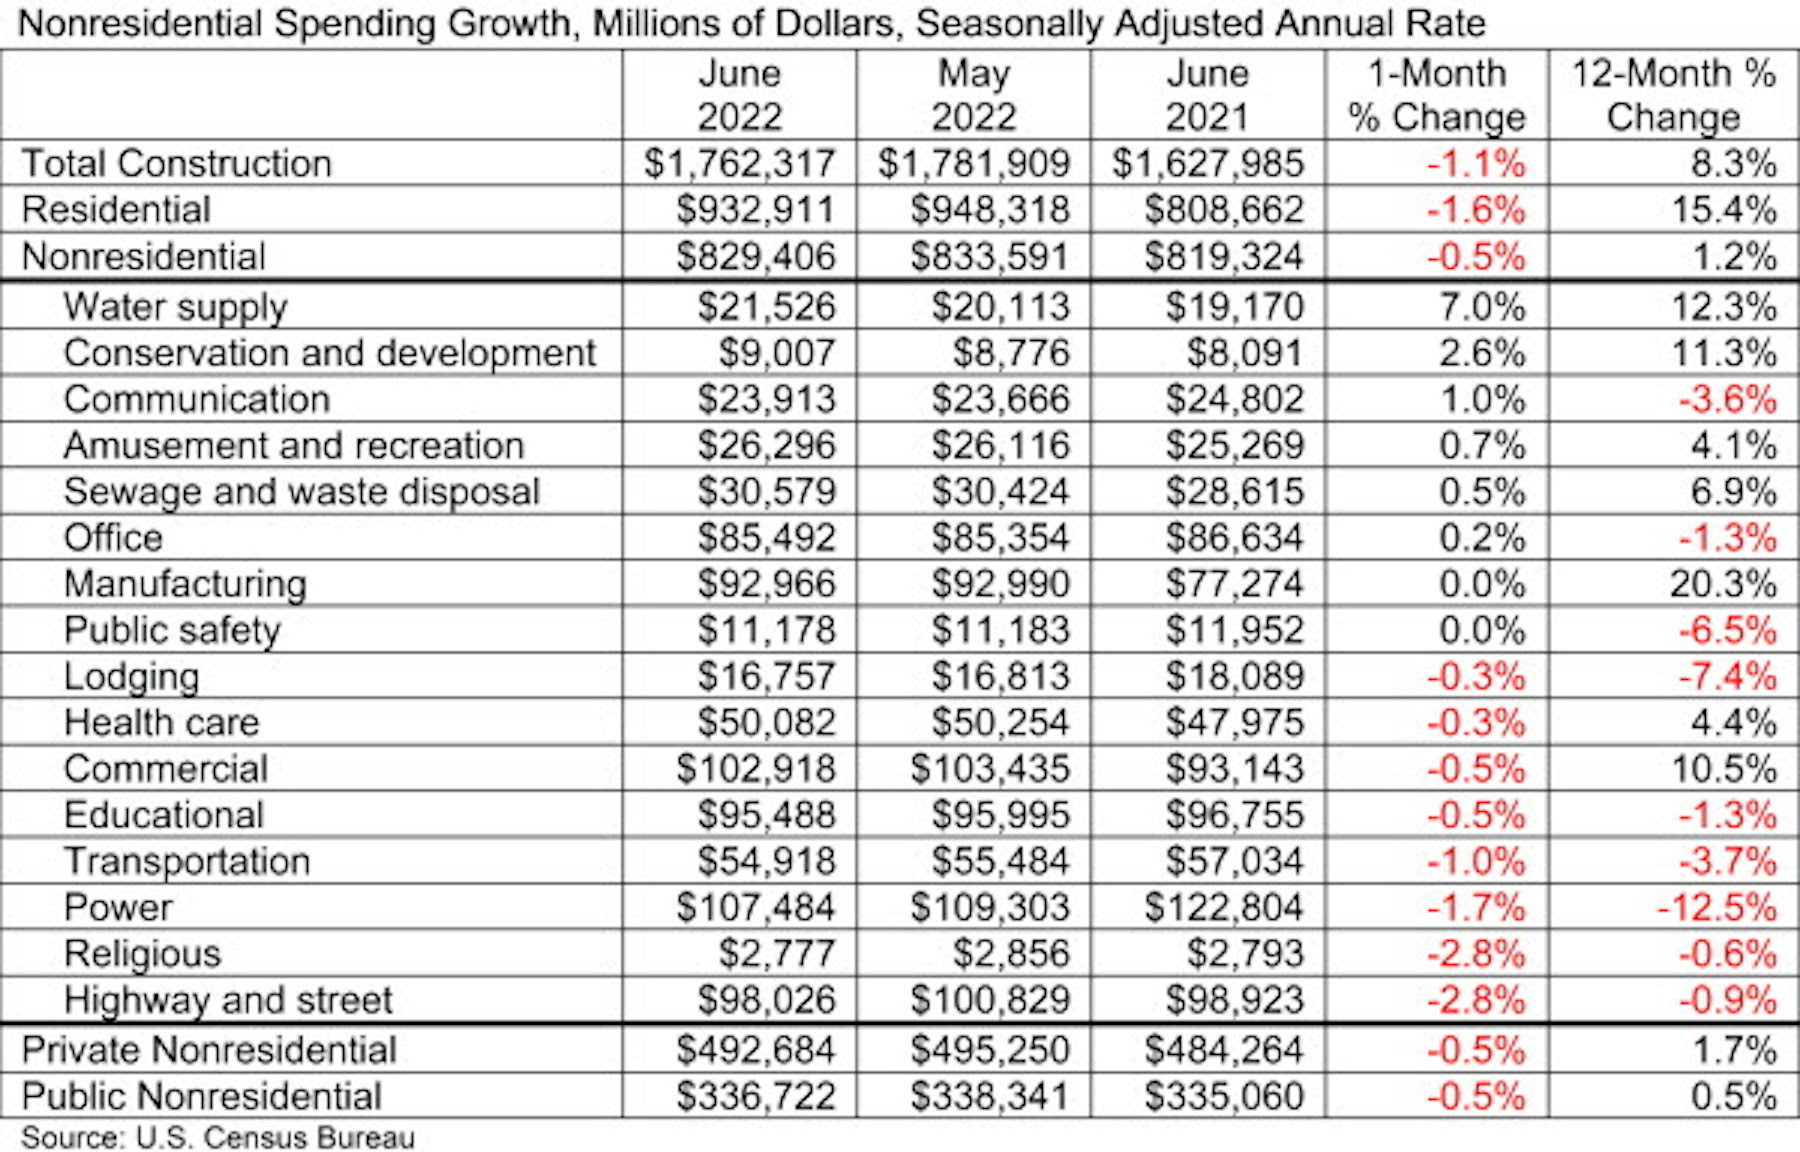
National nonresidential construction spending was down by 0.5% in June, according to an Associated Builders and Contractors analysis of data published today by the U.S. Census Bureau. On a seasonally adjusted annualized basis, nonresidential spending totaled $829.4 billion for the month.
Spending was down on a monthly basis in eight of the 16 nonresidential subcategories. Both private and public nonresidential spending fell by 0.5% in June.
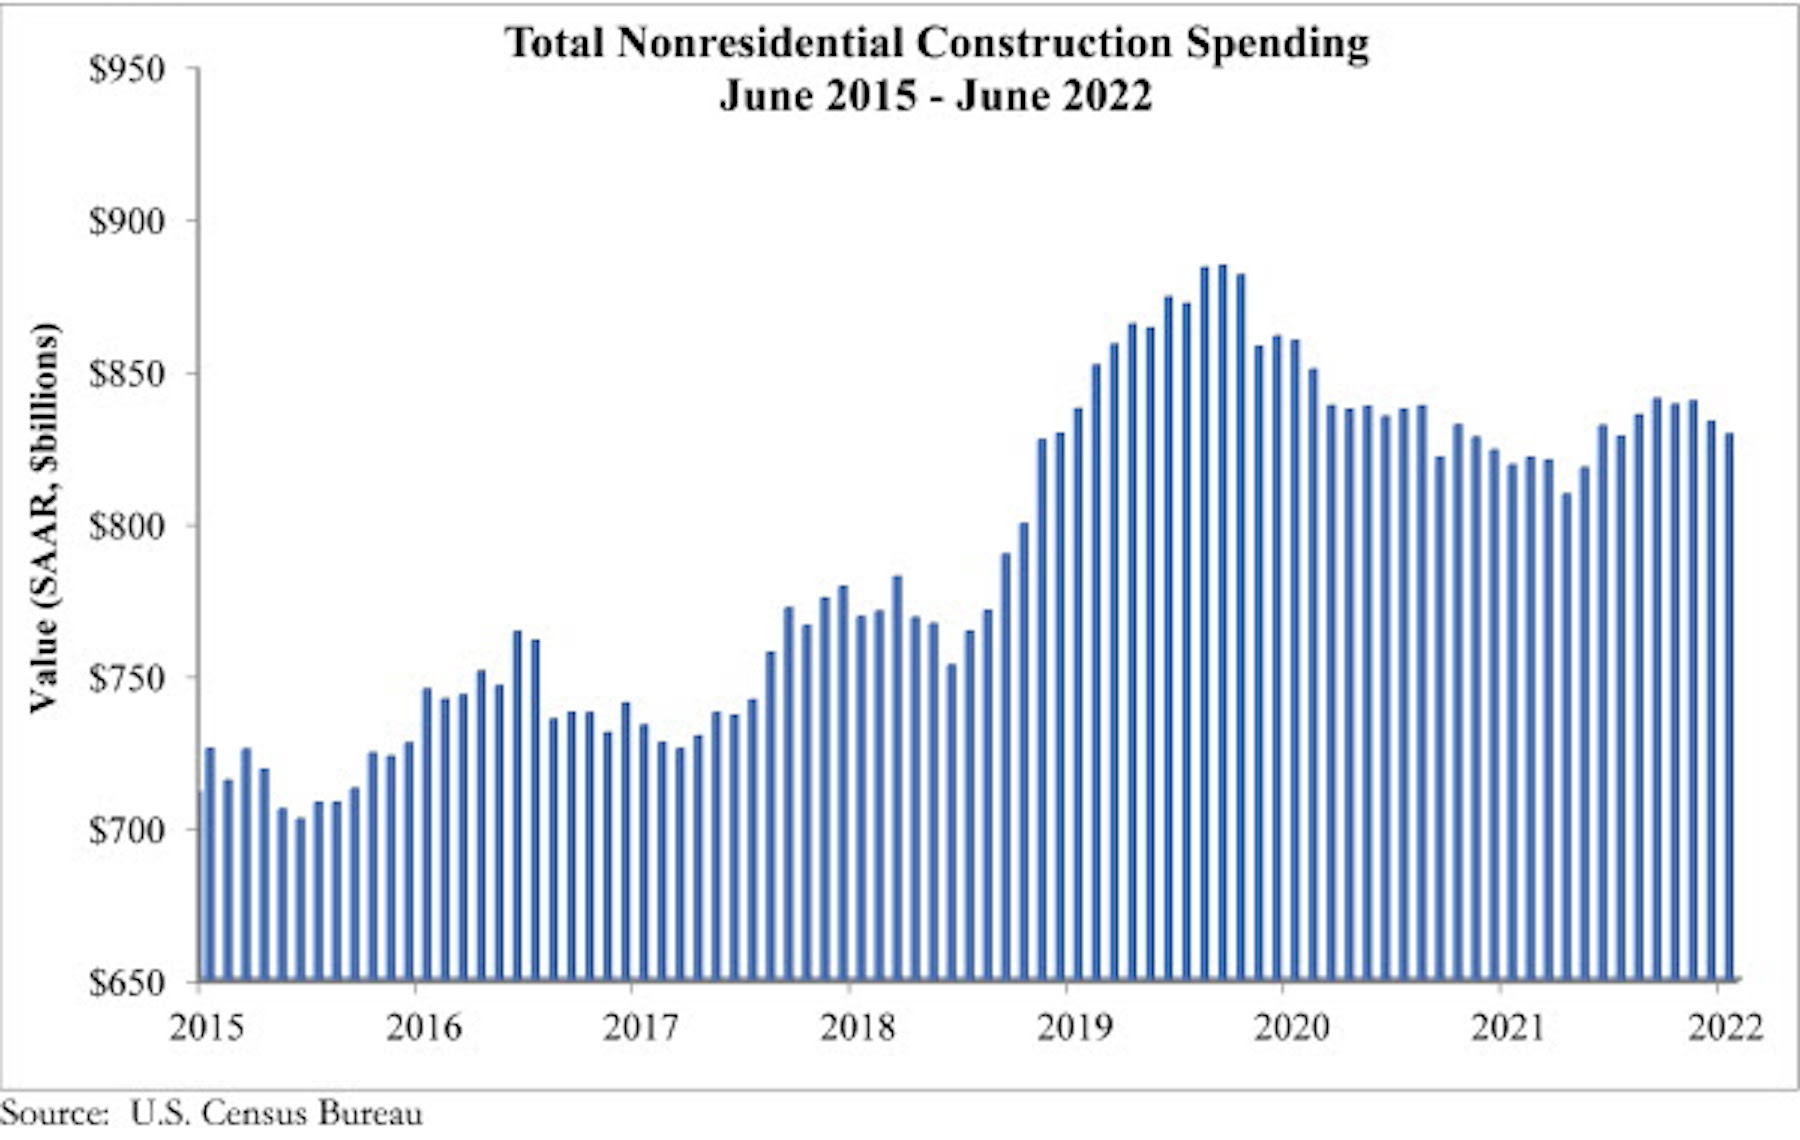
“There continues to be significant downward pressure on nonresidential construction spending volumes, and that is likely to intensify going forward,” said ABC Chief Economist Anirban Basu. “To date, construction spending measured in dollars has been propped up by elevated construction delivery costs, including higher materials prices and rapidly rising wages. Despite those inflationary pressures, aggregate nonresidential construction spending has failed to recover to pre-pandemic levels in nominal terms. The situation looks even worse when adjusting for inflation.
“The primary issue is that those high construction delivery charges are inducing a significant fraction of project owners to reconsider start dates,” said Basu. “True, backlog remains elevated, according to ABC’s Construction Backlog Indicator, but this may be because it is taking longer to complete projects. Additional project delays and cancellations are likely as borrowing costs continue to ratchet higher for those who purchase construction services and as the risk of recession increases. For now, many contractors remain busy and continue to operate at or near capacity. Whether that will continue for another 12 to 18 months remains an unanswered question.”
Related Stories

Market Data | Jan 29, 2018
Year-end data show economy expanded in 2017; Fixed investment surged in fourth quarter
The economy expanded at an annual rate of 2.6% during the fourth quarter of 2017.

Market Data | Jan 25, 2018
Renters are the majority in 42 U.S. cities
Over the past 10 years, the number of renters has increased by 23 million.

Market Data | Jan 24, 2018
HomeUnion names the most and least affordable rental housing markets
Chicago tops the list as the most affordable U.S. metro, while Oakland, Calif., is the most expensive rental market.

Market Data | Jan 12, 2018
Construction input prices inch down in December, Up YOY despite low inflation
Energy prices have been more volatile lately.

Market Data | Jan 4, 2018
Nonresidential construction spending ticks higher in November, down year-over-year
Despite the month-over-month expansion, nonresidential spending fell 1.3 percent from November 2016.

Contractors | Jan 4, 2018
Construction spending in a ‘mature’ period of incremental growth
Labor shortages are spiking wages. Materials costs are rising, too.
 reported the November ABI score was 55.0, up from a score of 51.7 in the previous month. Photo: Pixabay")
Market Data | Dec 20, 2017
Architecture billings upturn shows broad strength
The American Institute of Architects (AIA) reported the November ABI score was 55.0, up from a score of 51.7 in the previous month.

Market Data | Dec 14, 2017
ABC chief economist predicts stable 2018 construction economy
There are risks to the 2018 outlook as a number of potential cost increases could come into play.

Market Data | Dec 13, 2017
Top world regions and markets in the global hotel construction pipeline
The top world region by project count is North America.

Market Data | Dec 11, 2017
Global hotel construction pipeline is growing
The Total Pipeline stands at 12,427 Projects/2,084,940 Rooms.


