

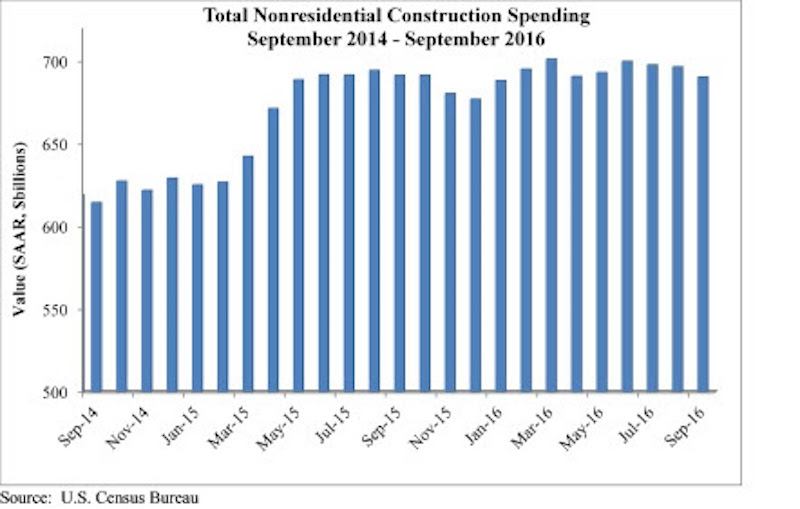
Nonresidential construction spending fell 0.9 percent from August to September 2016, according to analysis of U.S. Census Bureau data released today by Associated Builders and Contractors (ABC). Nonresidential spending totaled $690.5 billion on a seasonally adjusted, annualized basis for the month, 0.7 percent below September 2015’s figure.
The government revised the August nonresidential construction spending estimate from $686.6 billion to $696.6 billion; otherwise September spending would have risen on a month-over-month basis. Eleven of 16 nonresidential construction subsectors experienced monthly declines.
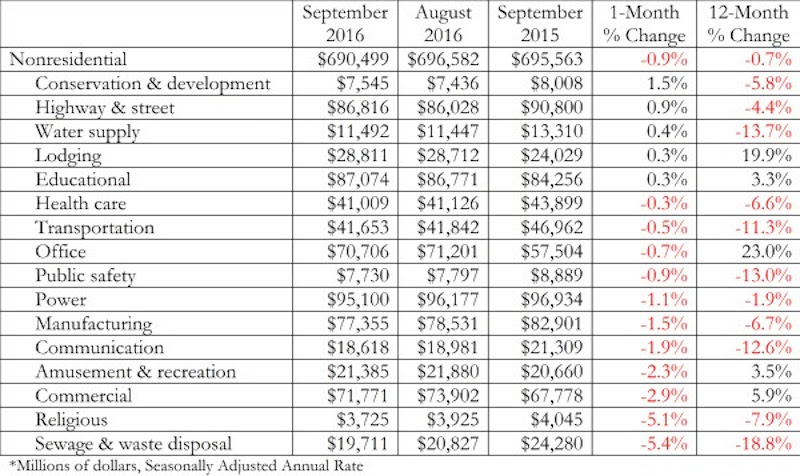
“A number of primarily publicly financed construction segments have experienced declines in spending over the past year, including sewage and waste disposal (-18.8%), water supply (-13.7%), public safety (-13.0%) and transportation (-11.3%). Meanwhile, the level of construction spending in office, lodging and commercial segments is up on a year-over-year basis, though spending in the office and commercial categories was down on a month-over-month basis and lodging-related construction was roughly flat,” says ABC Chief Economist Anirban Basu. “Nonresidential construction spending growth may not accelerate anytime soon, though there is some hope that the period following the elections will usher forth a period of renewed spending growth."

Related Stories

Market Data | Apr 13, 2017
2016’s top 10 states for commercial development
Three new states creep into the top 10 while first and second place remain unchanged.

Market Data | Apr 6, 2017
Architecture marketing: 5 tools to measure success
We’ve identified five architecture marketing tools that will help your firm evaluate if it’s on the track to more leads, higher growth, and broader brand visibility.

Market Data | Apr 3, 2017
Public nonresidential construction spending rebounds; overall spending unchanged in February
The segment totaled $701.9 billion on a seasonally adjusted annualized rate for the month, marking the seventh consecutive month in which nonresidential spending sat above the $700 billion threshold.

Market Data | Mar 29, 2017
Contractor confidence ends 2016 down but still in positive territory
Although all three diffusion indices in the survey fell by more than five points they remain well above the threshold of 50, which signals that construction activity will continue to be one of the few significant drivers of economic growth.

Market Data | Mar 24, 2017
These are the most and least innovative states for 2017
Connecticut, Virginia, and Maryland are all in the top 10 most innovative states, but none of them were able to claim the number one spot.

Market Data | Mar 22, 2017
After a strong year, construction industry anxious about Washington’s proposed policy shifts
Impacts on labor and materials costs at issue, according to latest JLL report.

Market Data | Mar 22, 2017
Architecture Billings Index rebounds into positive territory
Business conditions projected to solidify moving into the spring and summer.

Market Data | Mar 15, 2017
ABC's Construction Backlog Indicator fell to end 2016
Contractors in each segment surveyed all saw lower backlog during the fourth quarter, with firms in the heavy industrial segment experiencing the largest drop.

Market Data | Feb 28, 2017
Leopardo’s 2017 Construction Economics Report shows year-over-year construction spending increase of 4.2%
The pace of growth was slower than in 2015, however.

Market Data | Feb 23, 2017
Entering 2017, architecture billings slip modestly
Despite minor slowdown in overall billings, commercial/ industrial and institutional sectors post strongest gains in over 12 months.


