


Transwestern’s latest national office report reflects resilience in market fundamentals, even in the face of the moderating pace of U.S. economic growth demonstrated by net job creation averaging 172,000 per month for the first half of the year. In this environment, the national vacancy rate held steady at 9.7% in the second quarter thanks to healthy preleasing levels of newly delivered office assets.
“Signals continue to point to a disciplined office market that will perform well through year-end,” said Elizabeth Norton, Managing Director of Research at Transwestern. “Especially noteworthy is that in the second quarter, annual asking rental rates grew 4.2% year over year, the fastest rate this cycle and well above the five-year average of 3.4%.”
At quarter end, the average asking rental rate was $26.83 per square foot. Annual rent growth has been strongest in Tampa, Florida (10.6%), followed by Nashville, Tennessee (9.5%); San Jose/Silicon Valley, California (9.4%); Austin, Texas (8.8%); and San Francisco (8.8%).
Additionally, net absorption more than doubled to 24 million square feet in the second quarter despite sublet space adding 1.9 million square feet back to available inventory. Absorption leaders during the past year include Seattle; Charlotte, North Carolina; Dallas-Fort Worth; Los Angeles; and Northern Virginia. Seattle posted nearly 6 million square feet of absorption during the past 12 months, bringing the metro’s vacancy rate down to 6.1%, the fourth-lowest of the 49 markets tracked by Transwestern.
Office construction activity hit its highest level of this cycle, growing 9.6% during the prior 12 months. The second quarter saw more than 21.7 million square feet of new space added to inventory, and this pace will continue through the remainder of the year. Currently, 163.6 million square feet is in the pipeline nationally.
Download the full Second Quarter 2019 U.S. Office Market Report at: http://twurls.com/us-office-
Related Stories

Market Data | Dec 13, 2017
Top world regions and markets in the global hotel construction pipeline
The top world region by project count is North America.

Market Data | Dec 11, 2017
Global hotel construction pipeline is growing
The Total Pipeline stands at 12,427 Projects/2,084,940 Rooms.
Market Data | Dec 11, 2017
Construction backlog surges, sets record in third quarter
CBI is a leading economic indicator that reflects the amount of construction work under contract, but not yet completed.
Market Data | Dec 7, 2017
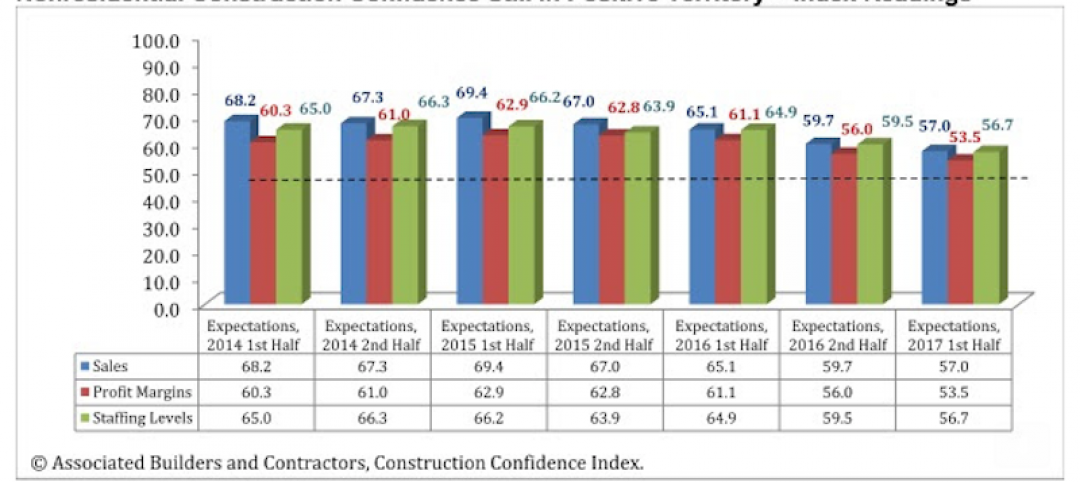
Buoyed by healthy economy, ABC Index finds contractors upbeat
Despite rising construction labor and materials costs, 55% of contractors expect their profit margins to expand in the first half of 2018.

Market Data | Dec 5, 2017
Top health systems engaged in $21 billion of U.S. construction projects
Largest active projects are by Sutter Health, New York Presbyterian, and Scripps Health.

Industry Research | Nov 28, 2017
2018 outlook: Economists point to slowdown, AEC professionals say ‘no way’
Multifamily housing and senior living developments head the list of the hottest sectors heading into 2018, according a survey of 356 AEC professionals.
Market Data | Nov 27, 2017
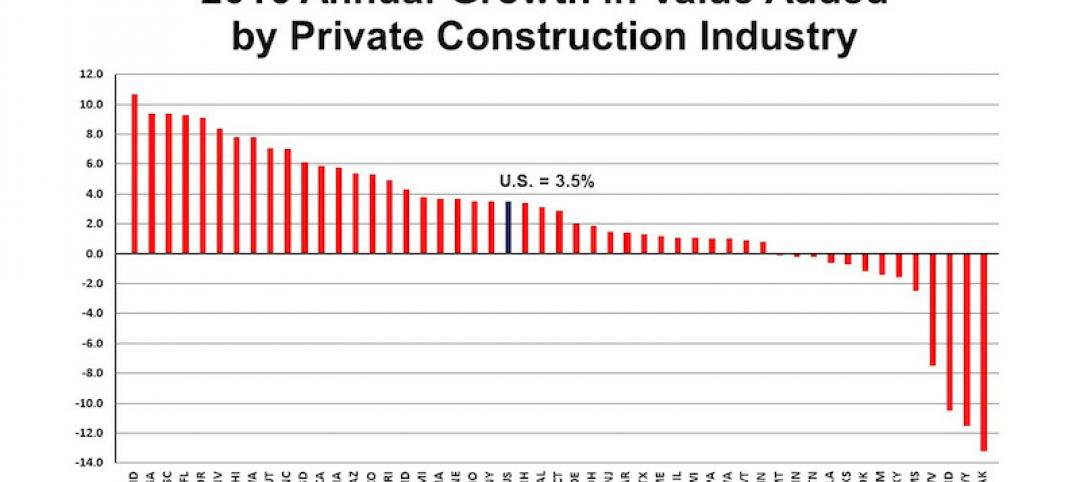
Construction's contribution to U.S. economy highest in seven years
Thirty-seven states benefited from the rise in construction activity in their state, while 13 states experienced a reduction in activity.
Market Data | Nov 15, 2017
Architecture Billings bounce back
Business conditions remain uneven across regions.
Market Data | Nov 14, 2017
U.S. construction starts had three consecutive quarters of positive growth in 2017
ConstructConnect’s quarterly report shows the most significant annual growth in the civil engineering and residential sectors.

Market Data | Nov 3, 2017
New construction starts in 2018 to increase 3% to $765 billion: Dodge report
Dodge Outlook Report predicts deceleration but still growth, reflecting a mixed pattern by project type.


