


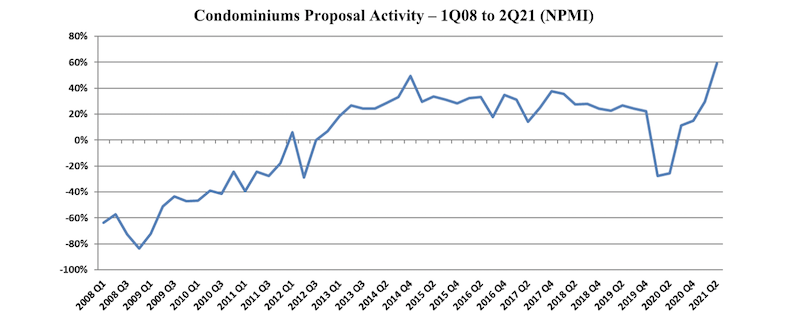
Proposal activity for Multifamily-for-Rent (Apartments) and Condominium properties continued to exceed historic norms, with Condos achieving its highest level since PSMJ Resources began tracking submarkets in its Quarterly Market Forecast (QMF) of A/E/C firm leaders. Apartments, which recorded its third-highest NPMI of 71% in the 1st Quarter, repeated that score in the 2nd Quarter.
While 61% of respondents working in the Condo market reported an increase in proposal activity from the 1st Quarter to the 2nd Quarter, only 2% saw a decline. This net plus/minus index (NPMI) of 59% exceeded the previous high for Condos of 49% achieved in the 4th Quarter of 2014.
Second-quarter proposal activity for Apartments continued to outpace all other submarkets in the Housing sector and all but one (Product Manufacturing) of the 58 submarkets measured across all construction sectors. A full three-quarters of the A/E/C firm leaders responding to PSMJ’s quarterly survey said that Multifamily proposal opportunities grew in the 2nd Quarter compared with only 4% who reported a decline.
The NPMI expresses the difference between the percentage of PSMJ member firms reporting an increase in proposal activity and those reporting a decrease. The QMF has proven to be a solid predictor of market health for 12 major markets served by the A/E/C industry since its inception in 2003, and for 58 submarkets since 2006.
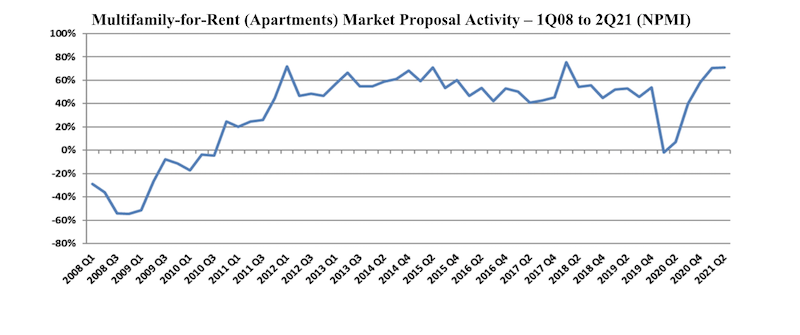
The record-high NPMI for Apartments was 76% in the 1st Quarter of 2018, followed by 72% in the 1st Quarter of 2012 and 71% in the 1st Quarters of 2015 and 2021.
PSMJ Senior Principal David Burstein, PE, AECPM, says the future strength of the housing market relies heavily on the ability of state and federal government agencies to invest adequately in infrastructure. “The condo and apartment markets have been on fire for several years, resulting in a lot of new multifamily housing,” says Burstein. “This is now creating traffic and other congestion problems which, if not dealt with by the cognizant government agencies, may cause the multifamily market to slow down in the coming quarters. So it is important to continue tracking the PSMJ NPMI over the next few quarters to spot any emerging slowdowns.”
The Assisted/Independent Senior Living submarket leveled off to an NPMI of 49%, down 10 NPMI percentage points from the 1st Quarter. While 51% of respondents reported an increase in proposal activity, only 2% saw a drop and the remaining 47% said opportunities were flat.
The two other Housing submarkets measured in the PSMJ survey remained strong. The Housing Subdivision market recorded an NPMI of 68% for a second straight month, as not a single respondent in the 2nd Quarter survey reported a decline in proposal opportunities. Single-Family Homes also repeated its 1st Quarter NPMI; the 51% index score once again tied for its second-highest level since the inception of submarket data tracking in the QMF.
PSMJ Resources, a consulting and publishing company dedicated to the A/E/C industry, has conducted its Quarterly Market Forecast for more than 18 years. It includes data on 12 major markets and 58 submarkets served by A/E/C firms. For more information, go to https://www.psmj.com/surveys/quarterly-market-forecast-2.
Related Stories

Hotel Facilities | Aug 2, 2023
Top 5 markets for hotel construction
According to the United States Construction Pipeline Trend Report by Lodging Econometrics (LE) for Q2 2023, the five markets with the largest hotel construction pipelines are Dallas with a record-high 184 projects/21,501 rooms, Atlanta with 141 projects/17,993 rooms, Phoenix with 119 projects/16,107 rooms, Nashville with 116 projects/15,346 rooms, and Los Angeles with 112 projects/17,797 rooms.

Market Data | Aug 1, 2023
Nonresidential construction spending increases slightly in June
National nonresidential construction spending increased 0.1% in June, according to an Associated Builders and Contractors analysis of data published today by the U.S. Census Bureau. Spending is up 18% over the past 12 months. On a seasonally adjusted annualized basis, nonresidential spending totaled $1.07 trillion in June.

Hotel Facilities | Jul 27, 2023
U.S. hotel construction pipeline remains steady with 5,572 projects in the works
The hotel construction pipeline grew incrementally in Q2 2023 as developers and franchise companies push through short-term challenges while envisioning long-term prospects, according to Lodging Econometrics.

Hotel Facilities | Jul 26, 2023
Hospitality building construction costs for 2023
Data from Gordian breaks down the average cost per square foot for 15-story hotels, restaurants, fast food restaurants, and movie theaters across 10 U.S. cities: Boston, Chicago, Las Vegas, Los Angeles, Miami, New Orleans, New York, Phoenix, Seattle, and Washington, D.C.

Market Data | Jul 24, 2023
Leading economists call for 2% increase in building construction spending in 2024
Following a 19.7% surge in spending for commercial, institutional, and industrial buildings in 2023, leading construction industry economists expect spending growth to come back to earth in 2024, according to the July 2023 AIA Consensus Construction Forecast Panel.

Contractors | Jul 13, 2023
Construction input prices remain unchanged in June, inflation slowing
Construction input prices remained unchanged in June compared to the previous month, according to an Associated Builders and Contractors analysis of U.S. Bureau of Labor Statistics Producer Price Index data released today. Nonresidential construction input prices were also unchanged for the month.

Contractors | Jul 11, 2023
The average U.S. contractor has 8.9 months worth of construction work in the pipeline, as of June 2023
Associated Builders and Contractors reported that its Construction Backlog Indicator remained unchanged at 8.9 months in June 2023, according to an ABC member survey conducted June 20 to July 5. The reading is unchanged from June 2022.

Market Data | Jul 5, 2023
Nonresidential construction spending decreased in May, its first drop in nearly a year
National nonresidential construction spending decreased 0.2% in May, according to an Associated Builders and Contractors analysis of data published today by the U.S. Census Bureau. On a seasonally adjusted annualized basis, nonresidential spending totaled $1.06 trillion.

Apartments | Jun 27, 2023
Average U.S. apartment rent reached all-time high in May, at $1,716
Multifamily rents continued to increase through the first half of 2023, despite challenges for the sector and continuing economic uncertainty. But job growth has remained robust and new households keep forming, creating apartment demand and ongoing rent growth. The average U.S. apartment rent reached an all-time high of $1,716 in May.

Industry Research | Jun 15, 2023
Exurbs and emerging suburbs having fastest population growth, says Cushman & Wakefield
Recently released county and metro-level population growth data by the U.S. Census Bureau shows that the fastest growing areas are found in exurbs and emerging suburbs.


