


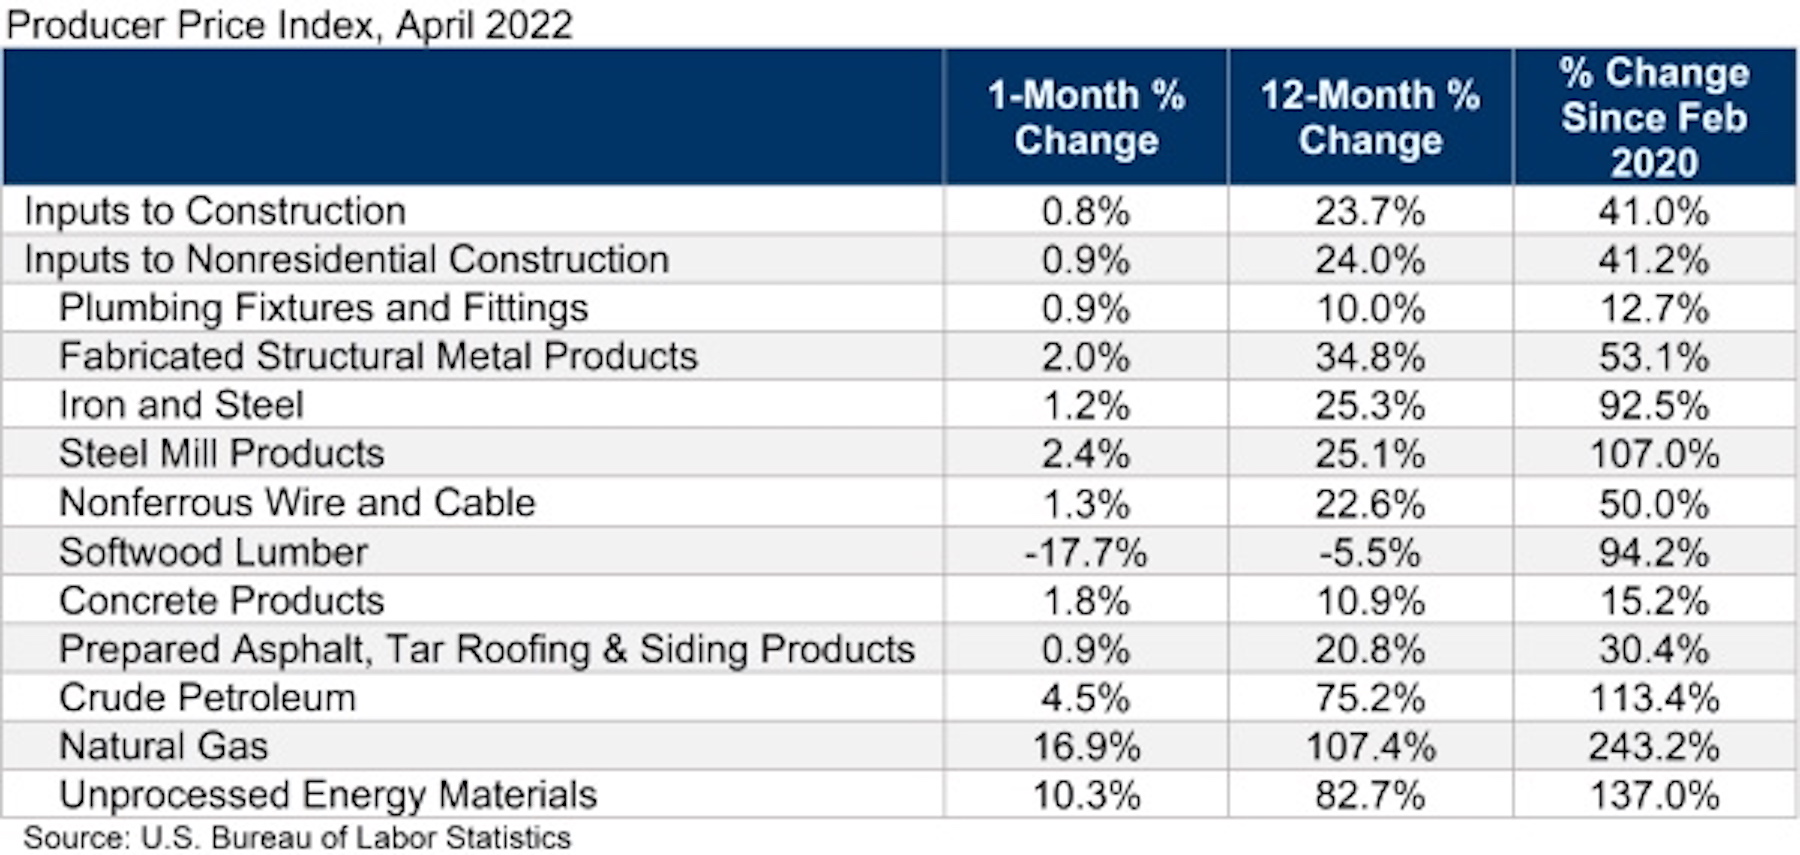
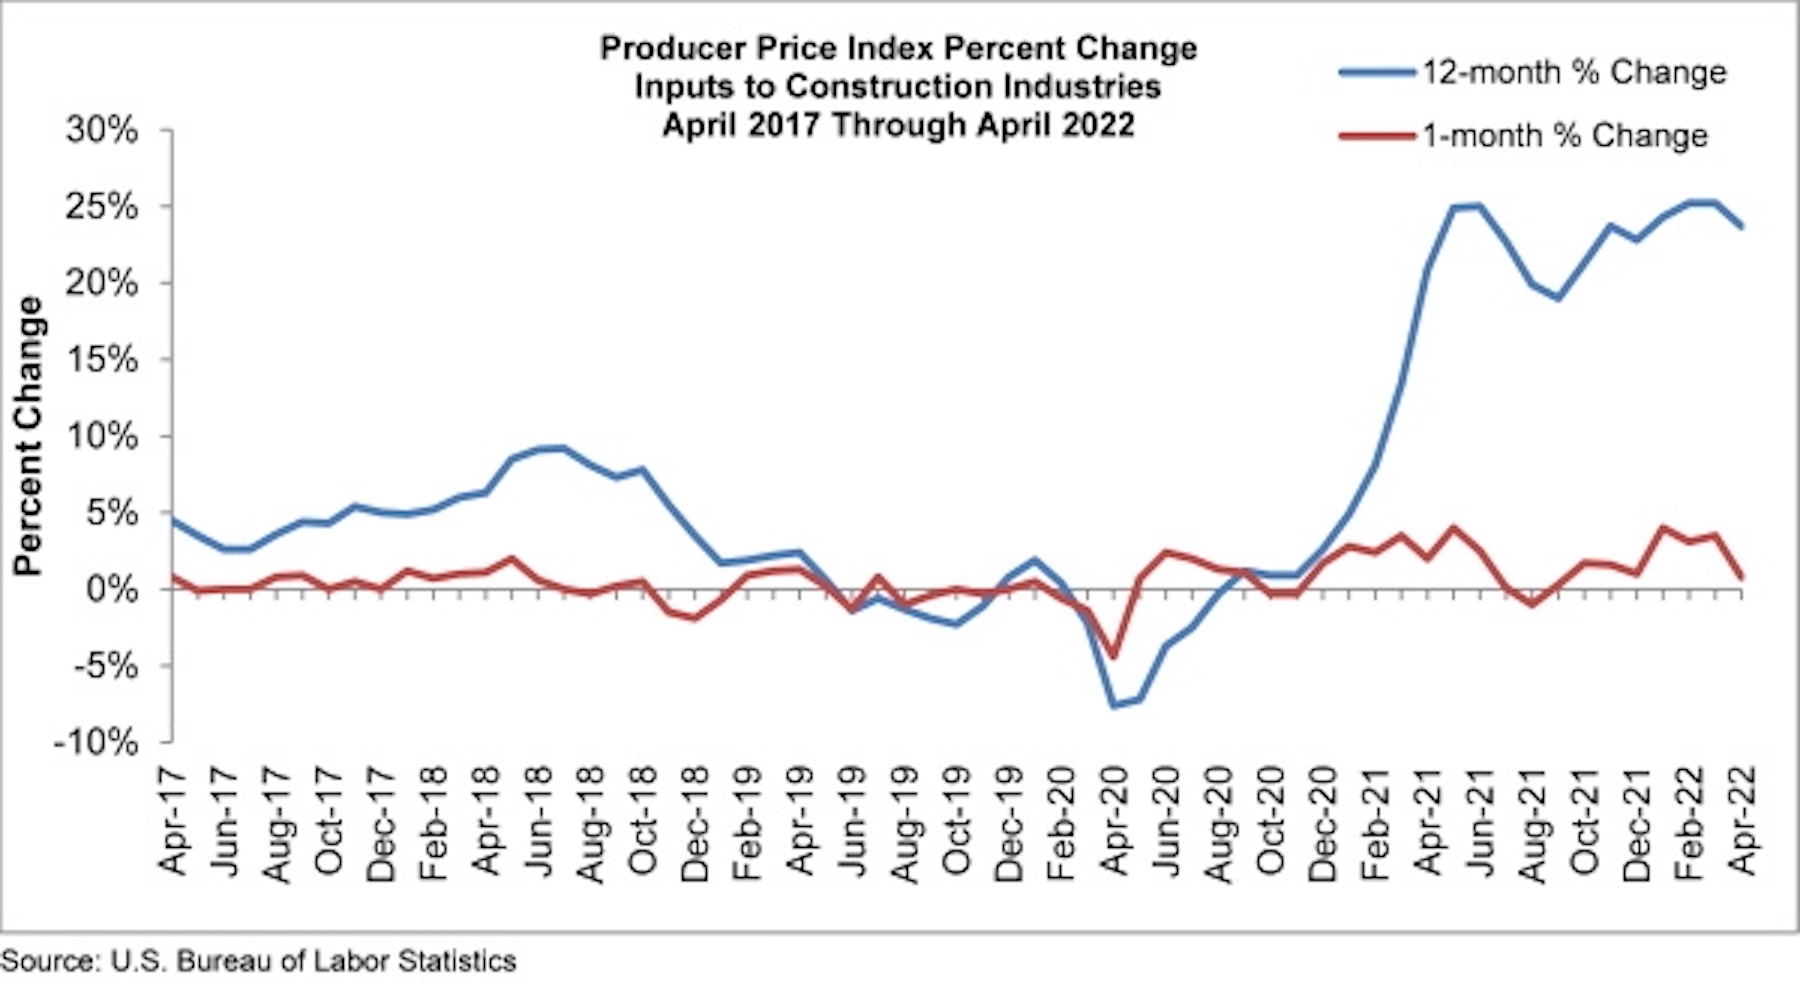
Construction input prices increased 0.8% in April compared to the previous month, according to an Associated Builders and Contractors analysis of U.S. Bureau of Labor Statistics’ Producer Price Index data released today. Nonresidential construction input prices rose 0.9% for the month.
Construction input prices are up 23.7% from a year ago, while nonresidential construction input prices are 24.0% higher. Input prices were up in 10 of 11 subcategories in April. Softwood lumber was the only category in which prices decreased, falling 17.7% for the month. The largest price increases were in natural gas (+16.9%) and unprocessed energy materials (+10.3%).
“There are some economists who believe that inflation has peaked,” said ABC Chief Economist Anirban Basu. “Even if that were true, stakeholders should not expect dramatic declines in inflation in the near term given an array of factors placing upward pressure on prices: the Russia-Ukraine war, COVID-19, a shrunken labor force, elevated transportation costs and abundant demand for goods. Today’s PPI release indicates that producers continue to ask for and receive elevated prices for their limited production. These high input prices will continue to circulate through the economy as production continues, whether in the form of manufactured goods, buildings or infrastructure.
“According to ABC’s Construction Confidence Index, many contractors report that demand for their services remains sufficiently robust for them to pass along the bulk of their cost increases to project owners,” said Basu. “But at some point, the economy could weaken to the point that purchasers of construction services become less willing to pay elevated prices.
“The Federal Reserve is now in the middle of what will likely prove a lengthy monetary tightening process, and higher borrowing costs are rendering project starts less likely, all things being equal. That said, certain segments are likely to power through this dynamic, should it happen. That includes public construction, given the recent passage and ongoing implementation of a large-scale American infrastructure package. It should be noted that recent inflation has reduced the return taxpayers will get per dollar spent on infrastructure.”
Related Stories

Hotel Facilities | Jan 22, 2024
U.S. hotel construction is booming, with a record-high 5,964 projects in the pipeline
The hotel construction pipeline hit record project counts at Q4, with the addition of 260 projects and 21,287 rooms over last quarter, according to Lodging Econometrics.

Multifamily Housing | Jan 15, 2024
Multifamily rent growth rate unchanged at 0.3%
The National Multifamily Report by Yardi Matrix highlights the highs and lows of the multifamily market in 2023. Despite strong demand, rent growth remained unchanged at 0.3 percent.

Self-Storage Facilities | Jan 5, 2024
The state of self-storage in early 2024
As the housing market cools down, storage facilities suffer from lower occupancy and falling rates, according to the December 2023 Yardi Matrix National Self Storage Report.

Designers | Dec 25, 2023
Redefining the workplace is a central theme in Gensler’s latest Design Report
The firm identifies eight mega trends that mostly stress human connections.

Contractors | Dec 12, 2023
The average U.S. contractor has 8.5 months worth of construction work in the pipeline, as of November 2023
Associated Builders and Contractors reported today that its Construction Backlog Indicator inched up to 8.5 months in November from 8.4 months in October, according to an ABC member survey conducted Nov. 20 to Dec. 4. The reading is down 0.7 months from November 2022.

Market Data | Nov 27, 2023
Number of employees returning to the office varies significantly by city
While the return-to-the-office trend is felt across the country, the percentage of employees moving back to their offices varies significantly according to geography, according to Eptura’s Q3 Workplace Index.

Market Data | Nov 14, 2023
The average U.S. contractor has 8.4 months worth of construction work in the pipeline, as of September 2023
Associated Builders and Contractors reported that its Construction Backlog Indicator declined to 8.4 months in October from 9.0 months in September, according to an ABC member survey conducted from Oct. 19 to Nov. 2. The reading is down 0.4 months from October 2022. Backlog now stands at its lowest level since the first quarter of 2022.

Multifamily Housing | Nov 9, 2023
Multifamily project completions forecast to slow starting 2026
Yardi Matrix has released its Q4 2023 Multifamily Supply Forecast, emphasizing a short-term spike and plateau of new construction.

Contractors | Nov 1, 2023
Nonresidential construction spending increases for the 16th straight month, in September 2023
National nonresidential construction spending increased 0.3% in September, according to an Associated Builders and Contractors analysis of data published today by the U.S. Census Bureau. On a seasonally adjusted annualized basis, nonresidential spending totaled $1.1 trillion.

Market Data | Oct 23, 2023
New data finds that the majority of renters are cost-burdened
The most recent data derived from the 2022 Census American Community Survey reveals that the proportion of American renters facing housing cost burdens has reached its highest point since 2012, undoing the progress made in the ten years leading up to the pandemic.


