

Construction employment in July remained below the levels reached before the pre-pandemic peak in February 2020 in 36 states, according to an analysis by the Associated General Contractors of America of government employment data released today. Association officials said construction employment would benefit from new federal infrastructure investments and urged the House to quickly pass the bipartisan infrastructure bill.
“This data shows that full recovery remains elusive for construction in most states,” said Ken Simonson, the association’s chief economist. “In fact, the fast-spreading COVID-19 delta variant may make it harder to find employees eligible to work on restricted sites and may also depress demand if some owners defer projects.”
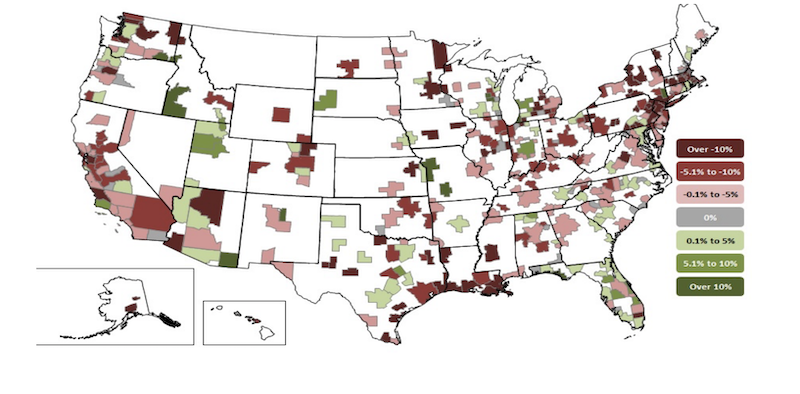
From February 2020—the month before the pandemic caused project shutdowns and cancellations—to last month, construction employment increased in only 14 states and was flat in the District of Columbia. Texas shed the most construction jobs over the period (-56,200 jobs or -7.2%), followed by New York (-52,600 jobs, -12.9%) and California (-35,100 jobs, -3.8%). Louisiana recorded the largest percentage loss (-15.3%, -21,000 jobs), followed by Wyoming (-13.5%, -3,100 jobs) and New York.
Of the states that added construction jobs since February 2020, Utah added the most (7,900 jobs, 6.9%), followed by North Carolina (5,700, 2.4%) and Idaho (4,400 jobs, 8.2%). The largest percentage gain was in Idaho, followed by South Dakota (7.5%, 1,800 jobs) and Utah.
From June to July construction employment decreased in 18 states, increased in 30, and was unchanged in Kansas, Tennessee, and D.C. The largest decline over the month occurred in Colorado, which lost 1,600 construction jobs or 0.9%, followed by a loss of 1,500 jobs each in Oklahoma (-1.9%), Texas (-0.2%), and Pennsylvania (0.6%). The steepest percentage declines since June occurred in New Hampshire (-2.2%, -600 jobs), followed by 1.9% losses in Oklahoma and Arkansas (-1,000 jobs).
North Carolina added the most construction jobs between June and July (4,300 jobs, 1.8%), followed by New Jersey (4,000 jobs, 2.7%) and Illinois (3,700 jobs, 1.7%). The largest percentage gains were in New Jersey and Connecticut (2.7%, 1,500 jobs), followed by South Carolina (2.4%, 2,600 jobs).
Association officials warned that construction employment was being impacted in many parts of the country because of supply chain challenges and growing market uncertainty caused by the resurgent Delta variant. They said new federal infrastructure investments would provide a needed boost in demand and help put more people to work in construction careers.
“New federal infrastructure investments will help put more people to work in high-paying construction careers,” said Stephen E. Sandherr, the association’s chief executive officer. “The House can help put Americans back to work by immediately approving the infrastructure measure that passed the Senate with broad, bipartisan support.”
View state February 2020-July 2021 data and rankings, 1-month rankings.c
Related Stories

Industry Research | Jan 30, 2018
AIA’s Kermit Baker: Five signs of an impending upturn in construction spending
Tax reform implications and rebuilding from natural disasters are among the reasons AIA’s Chief Economist is optimistic for 2018 and 2019.

Market Data | Jan 30, 2018
AIA Consensus Forecast: 4.0% growth for nonresidential construction spending in 2018
The commercial office and retail sectors will lead the way in 2018, with a strong bounce back for education and healthcare.

Market Data | Jan 29, 2018
Year-end data show economy expanded in 2017; Fixed investment surged in fourth quarter
The economy expanded at an annual rate of 2.6% during the fourth quarter of 2017.

Market Data | Jan 25, 2018
Renters are the majority in 42 U.S. cities
Over the past 10 years, the number of renters has increased by 23 million.

Market Data | Jan 24, 2018
HomeUnion names the most and least affordable rental housing markets
Chicago tops the list as the most affordable U.S. metro, while Oakland, Calif., is the most expensive rental market.

Market Data | Jan 12, 2018
Construction input prices inch down in December, Up YOY despite low inflation
Energy prices have been more volatile lately.

Market Data | Jan 4, 2018
Nonresidential construction spending ticks higher in November, down year-over-year
Despite the month-over-month expansion, nonresidential spending fell 1.3 percent from November 2016.

Contractors | Jan 4, 2018
Construction spending in a ‘mature’ period of incremental growth
Labor shortages are spiking wages. Materials costs are rising, too.
 reported the November ABI score was 55.0, up from a score of 51.7 in the previous month. Photo: Pixabay")
Market Data | Dec 20, 2017
Architecture billings upturn shows broad strength
The American Institute of Architects (AIA) reported the November ABI score was 55.0, up from a score of 51.7 in the previous month.

Market Data | Dec 14, 2017
ABC chief economist predicts stable 2018 construction economy
There are risks to the 2018 outlook as a number of potential cost increases could come into play.


