


Grumman|Butkus Associates, a firm of energy efficiency consultants and sustainable design engineers, recently released the results of its 2020 Hospital Energy and Water Benchmarking Survey, focusing on healthcare facilities’ resource usage trends and costs for calendar year 2019.
Since GBA initiated the survey more than 25 years ago, hospitals’ overall fossil fuel use has trended downward, but electricity use isn’t declining as much. The average combined Btu/ft2 (electricity plus gas/steam) for participating facilities was 233,491 in this year’s survey, down from 245,258 in CY2018. However, interpretation of year-to-year trends should be tempered by the realization that the respondent pool for the 2020 survey was smaller than, and different from, the pool from 2019, due to the stresses that COVID-19 response placed on the healthcare facility personnel who normally participate.
Square-foot prices for gas/steam fell ($0.67 in 2919, compared with $0.74 in 2018), and square-foot prices for electricity were also down ($2.32 in 2019, compared with $2.41 in 2017). The overall result is that total reported ft2 costs for energy (gas/steam plus electric) decreased: $2.99 for 2019, compared with $3.31 for 2018.
Hospitals’ average carbon footprint has remained fairly steady at 50 to 60 pounds of CO2 equivalent per ft2 per year since GBA began calculating carbon data in 1999. “If we are going to address the very daunting issue of climate change, the healthcare industry must make greater strides in reducing its carbon footprint,” says Dan Doyle, GBA Chairman. “President Biden has proposed cutting greenhouse gas emissions by 50 to 52% by 2030 (from a 2005 baseline) and creating a net-zero-carbon economy by 2050. Hospitals have been making slow, steady progress to improve their energy efficiency, but the change has not been rapid enough.”
Participating facilities displayed a broad range of usage patterns. For instance, a few of this year’s survey participants reported fossil fuel consumption of more than 200,000 Btu/sf/year, compared with the general mid-range of facilities (about 130,000 Btu/sf/year) and those that used least (75,000 Btu/sf/year or less). These variations can be related to unique aspects of a site, and/or local variations in energy costs. Thus, our respondents’ fossil fuel energy costs may exceed $1.50/sf/year or come in at less than $0.50/sf/year.
Similarly, several hospitals reported consuming more than 40 kWh/sf/year in electrical energy, compared with a mid-range of about 27 kWh/sf/year. A few survey participants squeaked in at less than 15 kWh/sf/year. The wide differences in usage mean that some of our participants are paying well over $4/sf/year for electrical energy, while many are getting by at less than $2.50 and a few at less than $1.50.
“Facilities that have high unit costs for energy should view this as an opportunity,” says Doyle. “For example, an energy conservation project that would have a five-year payback at an ‘average’ facility may have a payback of just 2.5 or 3 years at a facility with higher unit costs for energy.”
He adds, "To meet the ambitious goals recently put forth by the Biden administration, hospitals will have to achieve much more significant reductions in the near term. These reductions can only be achieved by implementing larger and more costly retrofits of existing buildings. The drive to de-carbonize will also require building owners to embrace fuel switching, to renewable-based energy sources. Many leading healthcare systems are implementing on-site renewables (usually solar photovoltaic systems), as well as off-site renewables, often funded through Power Purchase Agreements (PPA), to purchase some or all of their electricity."
Hospital water/sewer use is also gradually declining, averaging about 41 gallons per square foot per year in CY2019 (compared with more than 60 gallons/ ft2/year a decade ago). Costs for water/sewer are generally rising, however. (The 2019 data reported by respondents, with an average annual water/sewer cost of $0.34 /ft2, represents a significant drop from 2018 but is likely a COVID-19 related reporting anomaly.)
“GBA expects the trend of rising water and sewer costs to continue,” says Doyle. “Price hikes not only reflect increasing costs to extract and treat the water, but also the fact that cash-strapped governmental entities may view water as a revenue source. Costs to upgrade or replace aging infrastructure are also contributing to escalating costs.”
Since 1995, the GBA survey has provided a free annual benchmarking resource. Hospitals are invited to participate by submitting responses to a short list of questions. Information for this edition was provided by 79 hospitals located in Illinois (33), Wisconsin (19), Michigan (12), Texas (5), and numerous other states coast-to-coast.
Full results and analysis, as well as information about participating in the 2021 survey (2020 data), are available at the firm’s website: grummanbutkus.com/HES. The 2020 data is important; it will be based on different operating conditions than in previous years. Respondents’ 2020 data will improve overall understanding of the pandemic's impact on hospital energy and water use, and increase knowledge within the healthcare community.
Related Stories
 reported the November ABI score was 55.0, up from a score of 51.7 in the previous month. Photo: Pixabay")
Market Data | Dec 20, 2017
Architecture billings upturn shows broad strength
The American Institute of Architects (AIA) reported the November ABI score was 55.0, up from a score of 51.7 in the previous month.

Market Data | Dec 14, 2017
ABC chief economist predicts stable 2018 construction economy
There are risks to the 2018 outlook as a number of potential cost increases could come into play.

Market Data | Dec 13, 2017
Top world regions and markets in the global hotel construction pipeline
The top world region by project count is North America.

Market Data | Dec 11, 2017
Global hotel construction pipeline is growing
The Total Pipeline stands at 12,427 Projects/2,084,940 Rooms.
Market Data | Dec 11, 2017
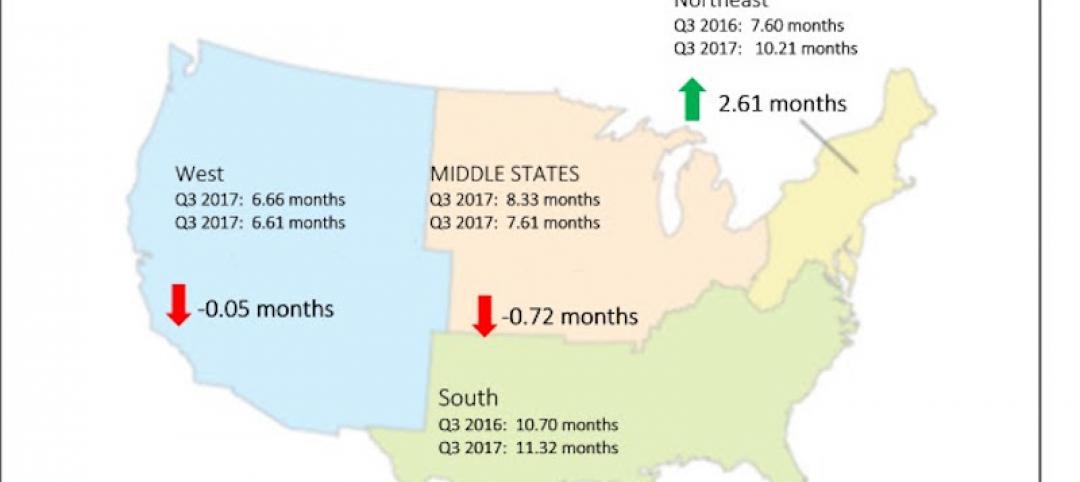
Construction backlog surges, sets record in third quarter
CBI is a leading economic indicator that reflects the amount of construction work under contract, but not yet completed.
Market Data | Dec 7, 2017
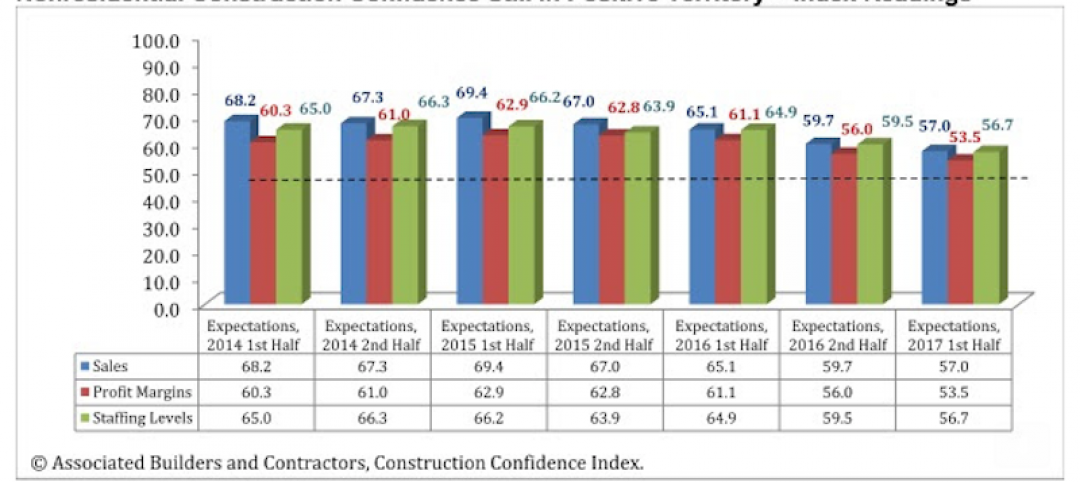
Buoyed by healthy economy, ABC Index finds contractors upbeat
Despite rising construction labor and materials costs, 55% of contractors expect their profit margins to expand in the first half of 2018.
Market Data | Dec 5, 2017
Top health systems engaged in $21 billion of U.S. construction projects
Largest active projects are by Sutter Health, New York Presbyterian, and Scripps Health.

Industry Research | Nov 28, 2017
2018 outlook: Economists point to slowdown, AEC professionals say ‘no way’
Multifamily housing and senior living developments head the list of the hottest sectors heading into 2018, according a survey of 356 AEC professionals.
Market Data | Nov 27, 2017
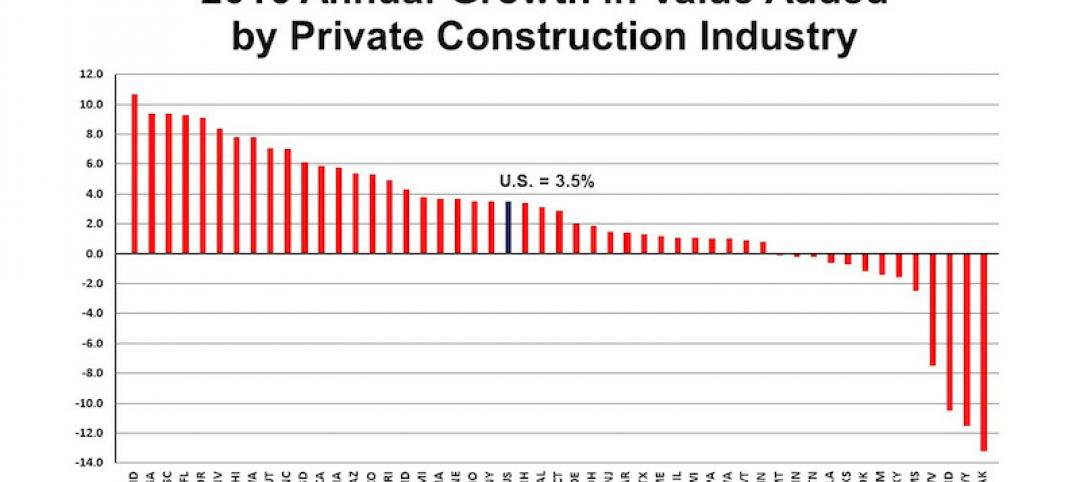
Construction's contribution to U.S. economy highest in seven years
Thirty-seven states benefited from the rise in construction activity in their state, while 13 states experienced a reduction in activity.
Market Data | Nov 15, 2017
Architecture Billings bounce back
Business conditions remain uneven across regions.


