


After a 20% falloff in 2013, the global wind power industry made a strong comeback in 2014, with a record 51.2 gigawatts (GW) installed, representing a 42% increase over the previous year, according to the BTM Consult arm of Navigant Research in its latest World Wind Energy Market Update 2015.
China alone installed a record 23.2 GW of new wind power last year. All told, the global five-year average growth rate was 7.8%, and cumulative installed capacity rose to 373 GW by the end of last year
However, Navigant projects a curtailment in the growth of annual new installations through 2019. Over that forecast period, installations are expected to increase by only 0.3% per year, and that includes an 8.9% growth in 2015. A total of 245,547 megawatts of wind power will be added over the forecast period, increasing cumulative capacity by 13.2% per year.
China will continue to lead the world in installation activity for the foreseeable future. But Navigant doesn’t expect that country to add more than 17 GWs in any given year.
Navigant foresees a “substantial” drop in installations in Germany due to changes in incentive structures after 5.1 GW of wind power were installed last year, which was higher than anticipated.
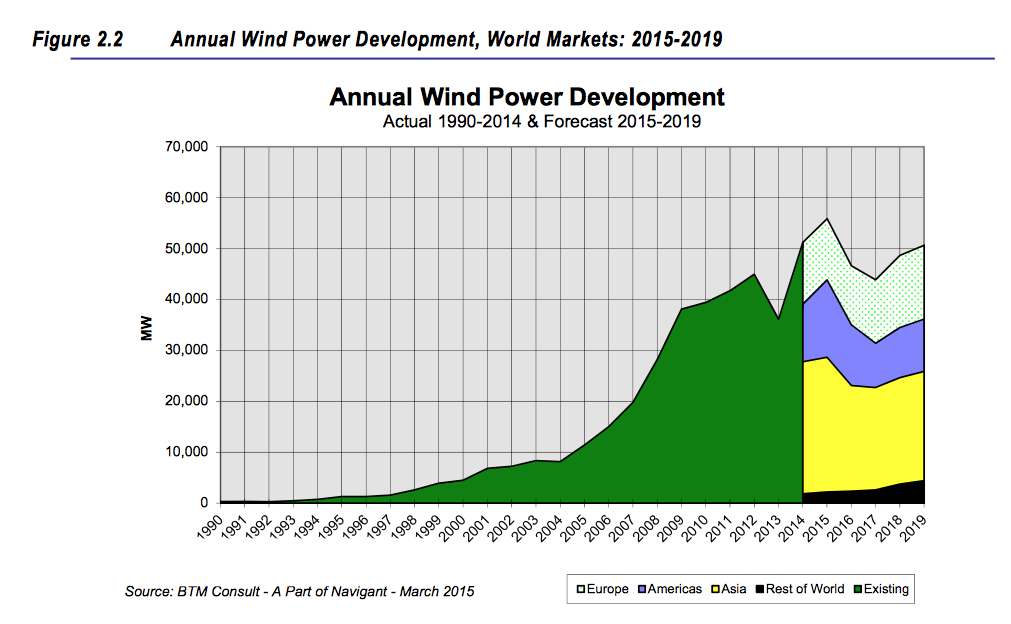 Chart from Navigant Research's wind power outlook
The U.S. wind power market has been recovering, thanks to the 2013 extension of the Production Tax Credit/Investment Tax Credit, as well as new safe-harbor guidance from the Internal Revenue Service about tax-credit eligibility. Navigant projects 14.8 GW will be installed in the U.S. in the years 2015 and 2016 combined.
In its 227-page report, Navigant notes that the average size of wind turbines increased only slightly in 2014, to 1,958 kilowatts (kW). The global market for direct-drive turbines grew 30% to 13,740 megawatts (MW), and represented 27% of all installations. In contrast, offshore wind grid connection and weather-related delays halved new offshore installations to 852 MWs in 2014.
Navigant notes that OEM sources are focusing more on product diversification, and are designed machines for maximum energy production in low wind speed areas, for operations in high altitudes or in cold climates, or for areas with blade-tip height restrictions. The evolution of larger rotor machines is leading to new blade designs, manufacturing processes, sourcing strategies, and supplier partnerships.
Interestingly, Navigant is seeing the hegemony of bigger players loosening a bit. Last year, the top 15 operator-owners controlled 29.3% of the market, or two percentage points lower than in 2013. “This exemplifies a trend of commercial acceptance in the utility marketplace. Demand for wind plants continues to move beyond the traditional owners that are historically comfortable with wind to new owners that are now convinced of the value wind plants bring to their portfolios,” Navigant reports.
Related Stories
| Sep 21, 2010
New BOMA-Kingsley Report Shows Compression in Utilities and Total Operating Expenses
A new report from the Building Owners and Managers Association (BOMA) International and Kingsley Associates shows that property professionals are trimming building operating expenses to stay competitive in today’s challenging marketplace. The report, which analyzes data from BOMA International’s 2010 Experience Exchange Report® (EER), revealed a $0.09 (1.1 percent) decrease in total operating expenses for U.S. private-sector buildings during 2009.
| Sep 21, 2010
Forecast: Existing buildings to earn 50% of green building certifications
A new report from Pike Research forecasts that by 2020, nearly half the green building certifications will be for existing buildings—accounting for 25 billion sf. The study, “Green Building Certification Programs,” analyzed current market and regulatory conditions related to green building certification programs, and found that green building remain robust during the recession and that certifications for existing buildings are an increasing area of focus.

| Sep 16, 2010
Gehry’s Santa Monica Place gets a wave of changes
Omniplan, in association with Jerde Partnership, created an updated design for Santa Monica Place, a shopping mall designed by Frank Gehry in 1980.
| Aug 11, 2010
AIA Course: Building with concrete – Design and construction techniques
Concrete maintains a special reputation for strength, durability, flexibility, and sustainability. These associations and a host of other factors have made it one of the most widely used building materials globally in just one century. Take this free AIA/CES course from Building Design+Construction and earn 1.0 AIA learning unit.


