


During the first half of 2018, five of the top ten metropolitan markets for commercial and multifamily construction starts ranked by dollar volume showed increased activity compared to a year ago, according to Dodge Data & Analytics. Of the top twenty markets, eleven were able to register gains. At the national level, the volume of commercial and multifamily construction starts during the first half of 2018 was $101.4 billion, down 1% from last year’s first half, although still 2% above what was reported during the first half of 2016.
The New York NY metropolitan area, at $16.1 billion during the first half of 2018, held onto its number one ranking and comprised 16% of the U.S. commercial and multifamily total, helped by a 44% jump compared to a year ago. During the previous two years, the New York NY share of the U.S. total had slipped to 14% in 2016 and 13% in 2017, after seeing its share reach a peak at 19% back in 2015. Other markets in the top ten showing growth during the first half of 2018 were Washington DC ($5.0 billion), up 23%; Miami FL ($4.9 billion), up 34%; Boston MA ($3.7 billion), up 56%; and Seattle WA ($3.2 billion), up 7%. Of these markets, the top four (New York, Washington DC, Miami, and Boston) showed renewed growth after the decreased activity reported for the full year 2017, while Seattle was able to maintain the upward track present last year. Metropolitan areas showing decreased activity for commercial and multifamily construction starts during the first half of 2018 were Dallas-Ft. Worth TX ($3.4 billion), down 23%; Los Angeles CA ($2.9 billion), down 38%; San Francisco CA ($2.8 billion), down 38%; Chicago IL ($2.7 billion), down 37%; and Atlanta GA ($2.0 billion), down 43%.
For those markets ranked 11 through 20, the six that registered first half 2018 gains were Austin TX ($1.8 billion), up 15%; Kansas City MO ($1.7 billion), up 52%; Orlando FL ($1.6 billion), up 4%; Phoenix AZ ($1.6 billion), up 19%; Minneapolis-St. Paul MN ($1.3 billion), up 34%; and Portland OR ($1.1 billion), up 15%. The four posting declines were Houston TX ($1.9 billion), down 13%; Philadelphia PA ($1.7 billion), down 13%; Denver CO ($1.6 billion), down 25%; and San Jose CA ($1.1 billion), down 37%.
The commercial and multifamily total is comprised of office buildings, stores, hotels, warehouses, commercial garages, and multifamily housing. At the U.S. level, the 1% drop for the commercial and multifamily total during the first half of 2018 reflected an 8% retreat for commercial building that was essentially balanced by an 8% increase for multifamily housing.

“Multifamily housing has proven to be surprisingly resilient so far during 2018, following its 8% decline in dollar terms at the U.S. level that was reported for the full year 2017,” stated Robert A. Murray, chief economist for Dodge Data & Analytics. “With apartment vacancy rates beginning to edge upward on a year-over-year basis, banks had been taking a more cautious stance towards lending for multifamily projects. Yet, after some loss of momentum during 2017, several factors appear to be providing near-term support for multifamily housing. The U.S. economy is currently moving at a healthy clip, with steady job growth bringing new workers into the labor force. The demand for multifamily housing by millennials remains
strong, given their desire to live in downtown areas while the increasing price of a single family home and diminished tax benefits may be dissuading some from making the transition to single family home ownership. As shown by this year’s surveys of bank lending officers conducted by the Federal Reserve, the extent of bank tightening for multifamily construction loans is not as widespread as a year ago.”
“On a broader level for commercial building, lending standards for nonresidential building loans have eased slightly over the past two quarters,” Murray continued. “And, the rollback of some of the Dodd-Frank restraints on the banking sector may encourage mid-size banks to increase lending for commercial real estate. While the expansion for commercial building and multifamily construction starts has clearly decelerated, the near-term shift appears to be one towards a plateau as opposed to a decline. This is consistent with the recent pattern for commercial and multifamily construction starts by major metropolitan areas, which reveals a fairly equal balance between those markets still showing gains and those markets showing decreased activity.”
Related Stories
Market Data | Mar 19, 2018
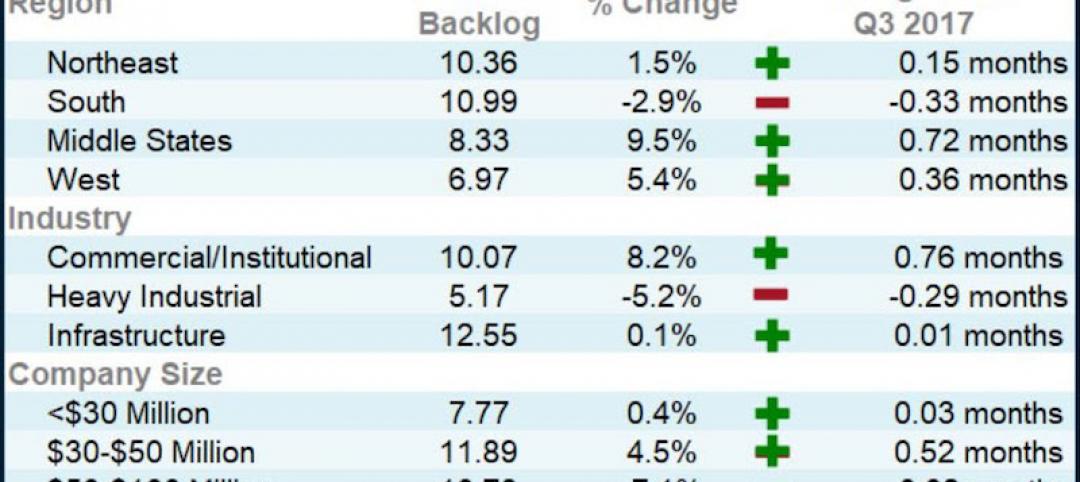
ABC's Construction Backlog Indicator hits a new high: 2018 poised to be a very strong year for construction spending
CBI is up by 1.36 months, or 16.3%, on a year-over-year basis.

Market Data | Mar 15, 2018
ABC: Construction materials prices continue to expand briskly in February
Compared to February 2017, prices are up 5.2%.

Market Data | Mar 14, 2018
AGC: Tariff increases threaten to make many project unaffordable
Construction costs escalated in February, driven by price increases for a wide range of building materials, including steel and aluminum.

Market Data | Mar 12, 2018
Construction employers add 61,000 jobs in February and 254,000 over the year
Hourly earnings rise 3.3% as sector strives to draw in new workers.

Steel Buildings | Mar 9, 2018
New steel and aluminum tariffs will hurt construction firms by raising materials costs; potential trade war will dampen demand, says AGC of America
Independent studies suggest the construction industry could lose nearly 30,000 jobs as a result of administration's new tariffs as many firms will be forced to absorb increased costs.

Market Data | Mar 8, 2018
Prioritizing your marketing initiatives
It’s time to take a comprehensive look at your plans and figure out the best way to get from Point A to Point B.

Market Data | Mar 6, 2018
Persistent workforce shortages challenge commercial construction industry as U.S. building demands continue to grow
To increase jobsite efficiency and improve labor productivity, increasingly more builders are turning to alternative construction solutions.
Market Data | Mar 2, 2018
Nonresidential construction spending dips slightly in January
Private nonresidential construction fell 1.5% for the month, while public sector nonresidential spending increased 1.9%.
Market Data | Feb 27, 2018
AIA small firm report: Half of employees have ownership stake in their firm
The American Institute of Architects has released its first-ever Small Firm Compensation Report.

Market Data | Feb 21, 2018
Strong start for architecture billings in 2018
The American Institute of Architects reported the January 2018 ABI score was 54.7, up from a score of 52.8 in the previous month.


