


During the first half of 2018, five of the top ten metropolitan markets for commercial and multifamily construction starts ranked by dollar volume showed increased activity compared to a year ago, according to Dodge Data & Analytics. Of the top twenty markets, eleven were able to register gains. At the national level, the volume of commercial and multifamily construction starts during the first half of 2018 was $101.4 billion, down 1% from last year’s first half, although still 2% above what was reported during the first half of 2016.
The New York NY metropolitan area, at $16.1 billion during the first half of 2018, held onto its number one ranking and comprised 16% of the U.S. commercial and multifamily total, helped by a 44% jump compared to a year ago. During the previous two years, the New York NY share of the U.S. total had slipped to 14% in 2016 and 13% in 2017, after seeing its share reach a peak at 19% back in 2015. Other markets in the top ten showing growth during the first half of 2018 were Washington DC ($5.0 billion), up 23%; Miami FL ($4.9 billion), up 34%; Boston MA ($3.7 billion), up 56%; and Seattle WA ($3.2 billion), up 7%. Of these markets, the top four (New York, Washington DC, Miami, and Boston) showed renewed growth after the decreased activity reported for the full year 2017, while Seattle was able to maintain the upward track present last year. Metropolitan areas showing decreased activity for commercial and multifamily construction starts during the first half of 2018 were Dallas-Ft. Worth TX ($3.4 billion), down 23%; Los Angeles CA ($2.9 billion), down 38%; San Francisco CA ($2.8 billion), down 38%; Chicago IL ($2.7 billion), down 37%; and Atlanta GA ($2.0 billion), down 43%.
For those markets ranked 11 through 20, the six that registered first half 2018 gains were Austin TX ($1.8 billion), up 15%; Kansas City MO ($1.7 billion), up 52%; Orlando FL ($1.6 billion), up 4%; Phoenix AZ ($1.6 billion), up 19%; Minneapolis-St. Paul MN ($1.3 billion), up 34%; and Portland OR ($1.1 billion), up 15%. The four posting declines were Houston TX ($1.9 billion), down 13%; Philadelphia PA ($1.7 billion), down 13%; Denver CO ($1.6 billion), down 25%; and San Jose CA ($1.1 billion), down 37%.
The commercial and multifamily total is comprised of office buildings, stores, hotels, warehouses, commercial garages, and multifamily housing. At the U.S. level, the 1% drop for the commercial and multifamily total during the first half of 2018 reflected an 8% retreat for commercial building that was essentially balanced by an 8% increase for multifamily housing.

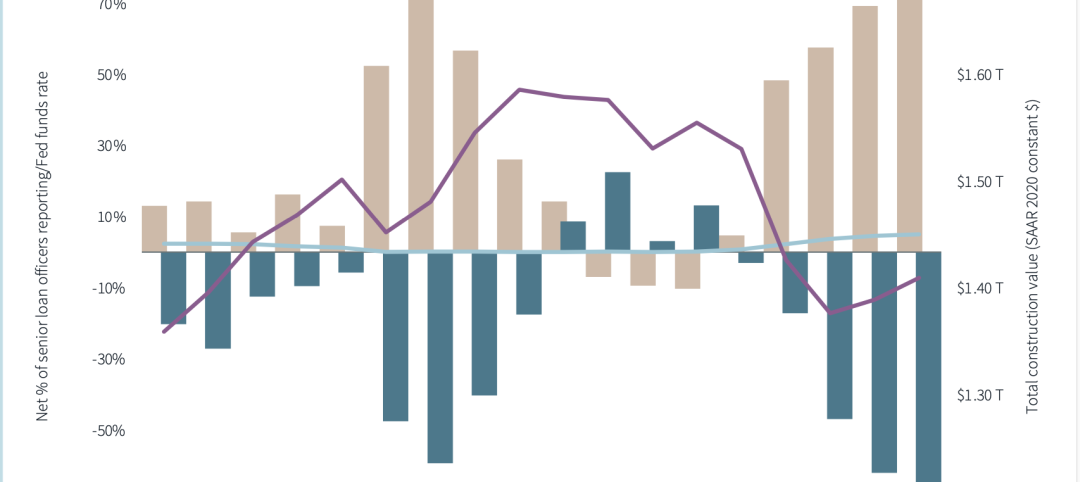
“Multifamily housing has proven to be surprisingly resilient so far during 2018, following its 8% decline in dollar terms at the U.S. level that was reported for the full year 2017,” stated Robert A. Murray, chief economist for Dodge Data & Analytics. “With apartment vacancy rates beginning to edge upward on a year-over-year basis, banks had been taking a more cautious stance towards lending for multifamily projects. Yet, after some loss of momentum during 2017, several factors appear to be providing near-term support for multifamily housing. The U.S. economy is currently moving at a healthy clip, with steady job growth bringing new workers into the labor force. The demand for multifamily housing by millennials remains
strong, given their desire to live in downtown areas while the increasing price of a single family home and diminished tax benefits may be dissuading some from making the transition to single family home ownership. As shown by this year’s surveys of bank lending officers conducted by the Federal Reserve, the extent of bank tightening for multifamily construction loans is not as widespread as a year ago.”
“On a broader level for commercial building, lending standards for nonresidential building loans have eased slightly over the past two quarters,” Murray continued. “And, the rollback of some of the Dodd-Frank restraints on the banking sector may encourage mid-size banks to increase lending for commercial real estate. While the expansion for commercial building and multifamily construction starts has clearly decelerated, the near-term shift appears to be one towards a plateau as opposed to a decline. This is consistent with the recent pattern for commercial and multifamily construction starts by major metropolitan areas, which reveals a fairly equal balance between those markets still showing gains and those markets showing decreased activity.”
Related Stories

Contractors | Oct 19, 2023
Crane Index indicates slowing private-sector construction
Private-sector construction in major North American cities is slowing, according to the latest RLB Crane Index. The number of tower cranes in use declined 10% since the first quarter of 2023. The index, compiled by consulting firm Rider Levett Bucknall (RLB), found that only two of 14 cities—Boston and Toronto—saw increased crane counts.

Market Data | Oct 2, 2023
Nonresidential construction spending rises 0.4% in August 2023, led by manufacturing and public works sectors
National nonresidential construction spending increased 0.4% in August, according to an Associated Builders and Contractors analysis of data published today by the U.S. Census Bureau. On a seasonally adjusted annualized basis, nonresidential spending totaled $1.09 trillion.

Giants 400 | Sep 28, 2023
Top 100 University Building Construction Firms for 2023
Turner Construction, Whiting-Turner Contracting Co., STO Building Group, Suffolk Construction, and Skanska USA top BD+C's ranking of the nation's largest university sector contractors and construction management firms for 2023, as reported in Building Design+Construction's 2023 Giants 400 Report. Note: This ranking includes revenue for all university/college-related buildings except student residence halls, sports/recreation facilities, laboratories, S+T-related buildings, parking facilities, and performing arts centers (revenue for those buildings are reported in their respective Giants 400 ranking).

Construction Costs | Sep 28, 2023
U.S. construction market moves toward building material price stabilization
The newly released Quarterly Construction Cost Insights Report for Q3 2023 from Gordian reveals material costs remain high compared to prior years, but there is a move towards price stabilization for building and construction materials after years of significant fluctuations. In this report, top industry experts from Gordian, as well as from Gilbane, McCarthy Building Companies, and DPR Construction weigh in on the overall trends seen for construction material costs, and offer innovative solutions to navigate this terrain.

Data Centers | Sep 21, 2023
North American data center construction rises 25% to record high in first half of 2023, driven by growth of artificial intelligence
CBRE’s latest North American Data Center Trends Report found there is 2,287.6 megawatts (MW) of data center supply currently under construction in primary markets, reaching a new all-time high with more than 70% already preleased.

Contractors | Sep 12, 2023
The average U.S. contractor has 9.2 months worth of construction work in the pipeline, as of August 2023
Associated Builders and Contractors' Construction Backlog Indicator declined to 9.2 months in August, down 0.1 month, according to an ABC member survey conducted from Aug. 21 to Sept. 6. The reading is 0.5 months above the August 2022 level.

Contractors | Sep 11, 2023
Construction industry skills shortage is contributing to project delays
Relatively few candidates looking for work in the construction industry have the necessary skills to do the job well, according to a survey of construction industry managers by the Associated General Contractors of America (AGC) and Autodesk.
Market Data | Sep 6, 2023
Far slower construction activity forecast in JLL’s Midyear update
The good news is that market data indicate total construction costs are leveling off.

Giants 400 | Sep 5, 2023
Top 80 Construction Management Firms for 2023
Alfa Tech, CBRE Group, Skyline Construction, Hill International, and JLL top the rankings of the nation's largest construction management (as agent) and program/project management firms for nonresidential buildings and multifamily housing work, as reported in Building Design+Construction's 2023 Giants 400 Report.

Giants 400 | Sep 5, 2023
Top 150 Contractors for 2023
Turner Construction, STO Building Group, DPR Construction, Whiting-Turner Contracting Co., and Clark Group head the ranking of the nation's largest general contractors, CM at risk firms, and design-builders for nonresidential buildings and multifamily buildings work, as reported in Building Design+Construction's 2023 Giants 400 Report.


