

Design-build delivered projects will account for nearly half of all construction spending by 2025, according to the consulting and investment firm FMI’s latest market research on design-built utilization.
FMI’s research for its 50-page report is based on a survey of 279 industry stakeholders and 46 interviews. FMI conducted the study in partnership with the Design-Build Institute of America (DBIA), and piggybacks on research in 2018 that confirmed design-build was no longer just an alternative delivery method, but one that had been embraced by a growing number of owner-developers and their AEC partners.
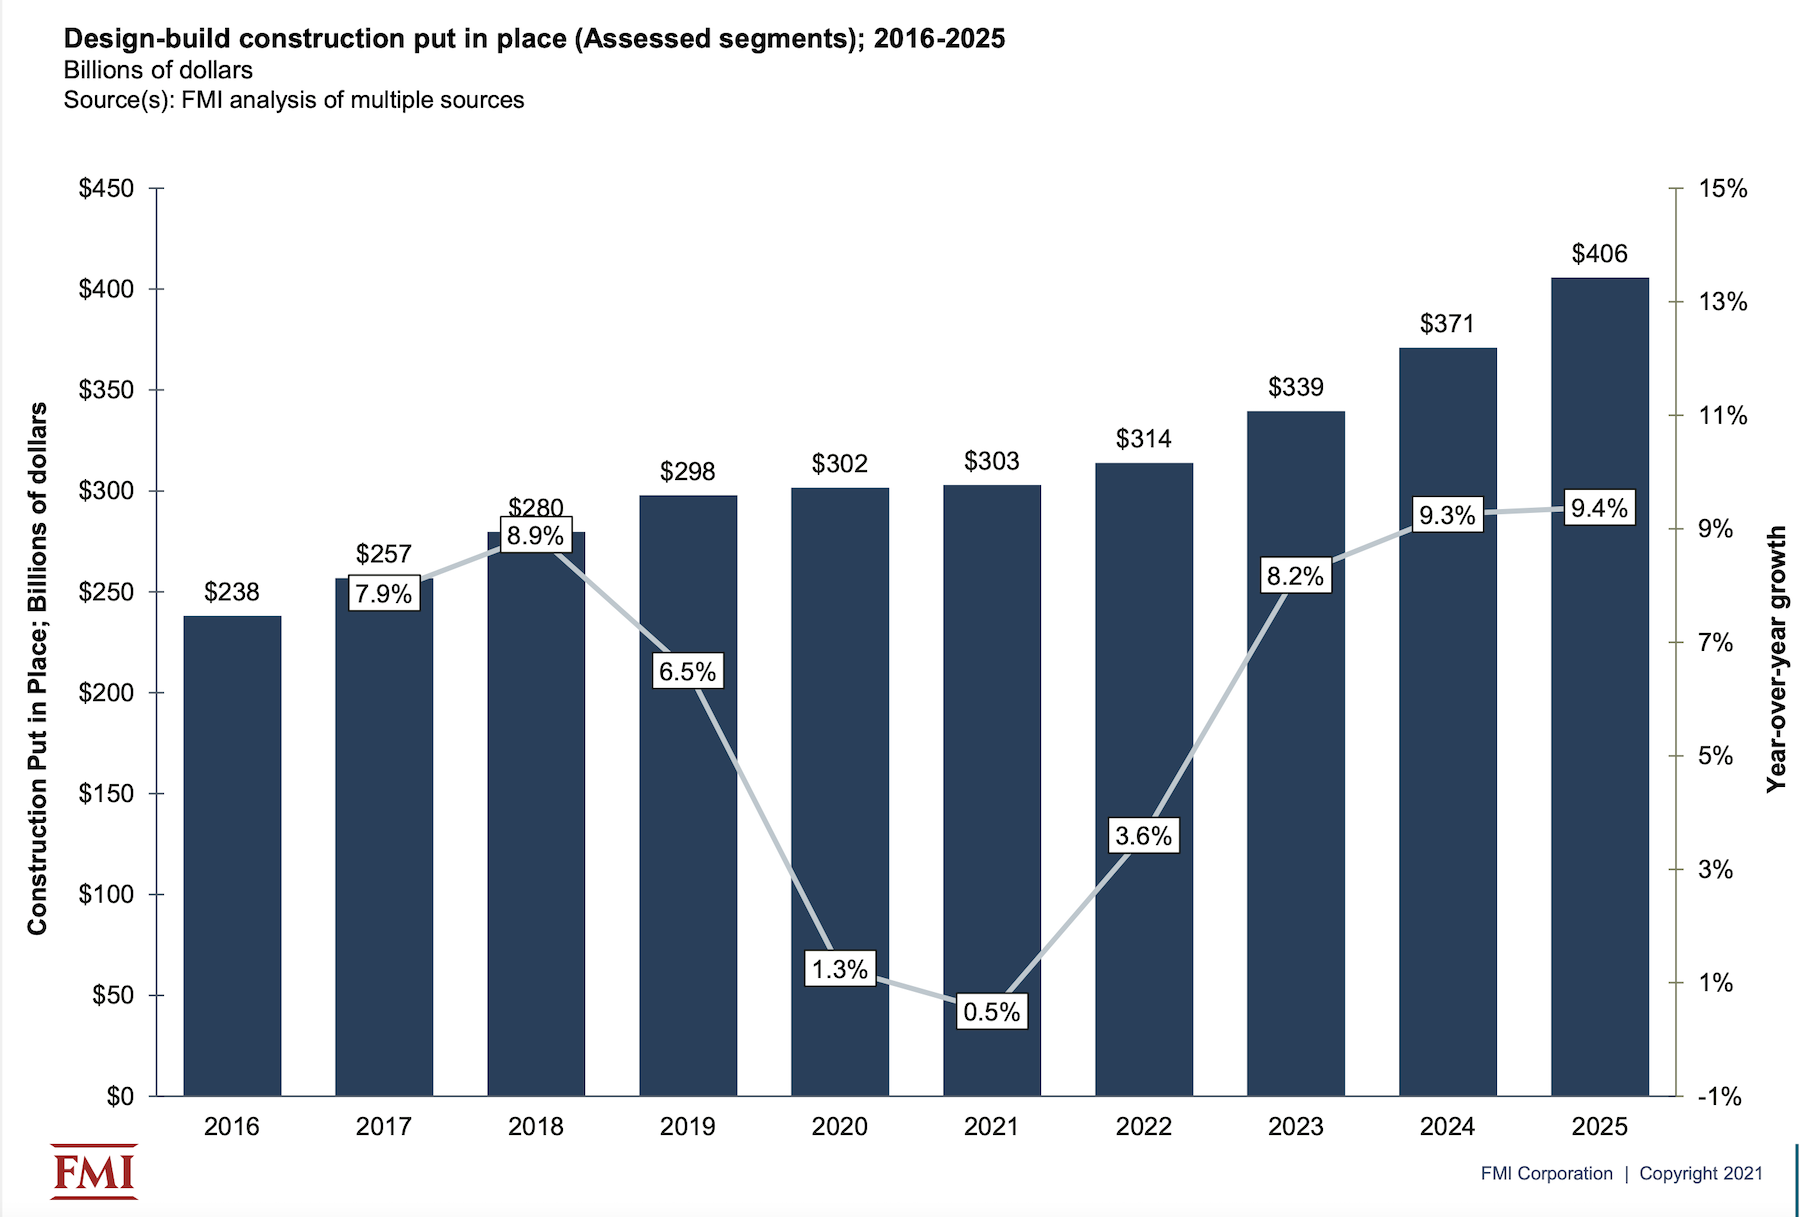
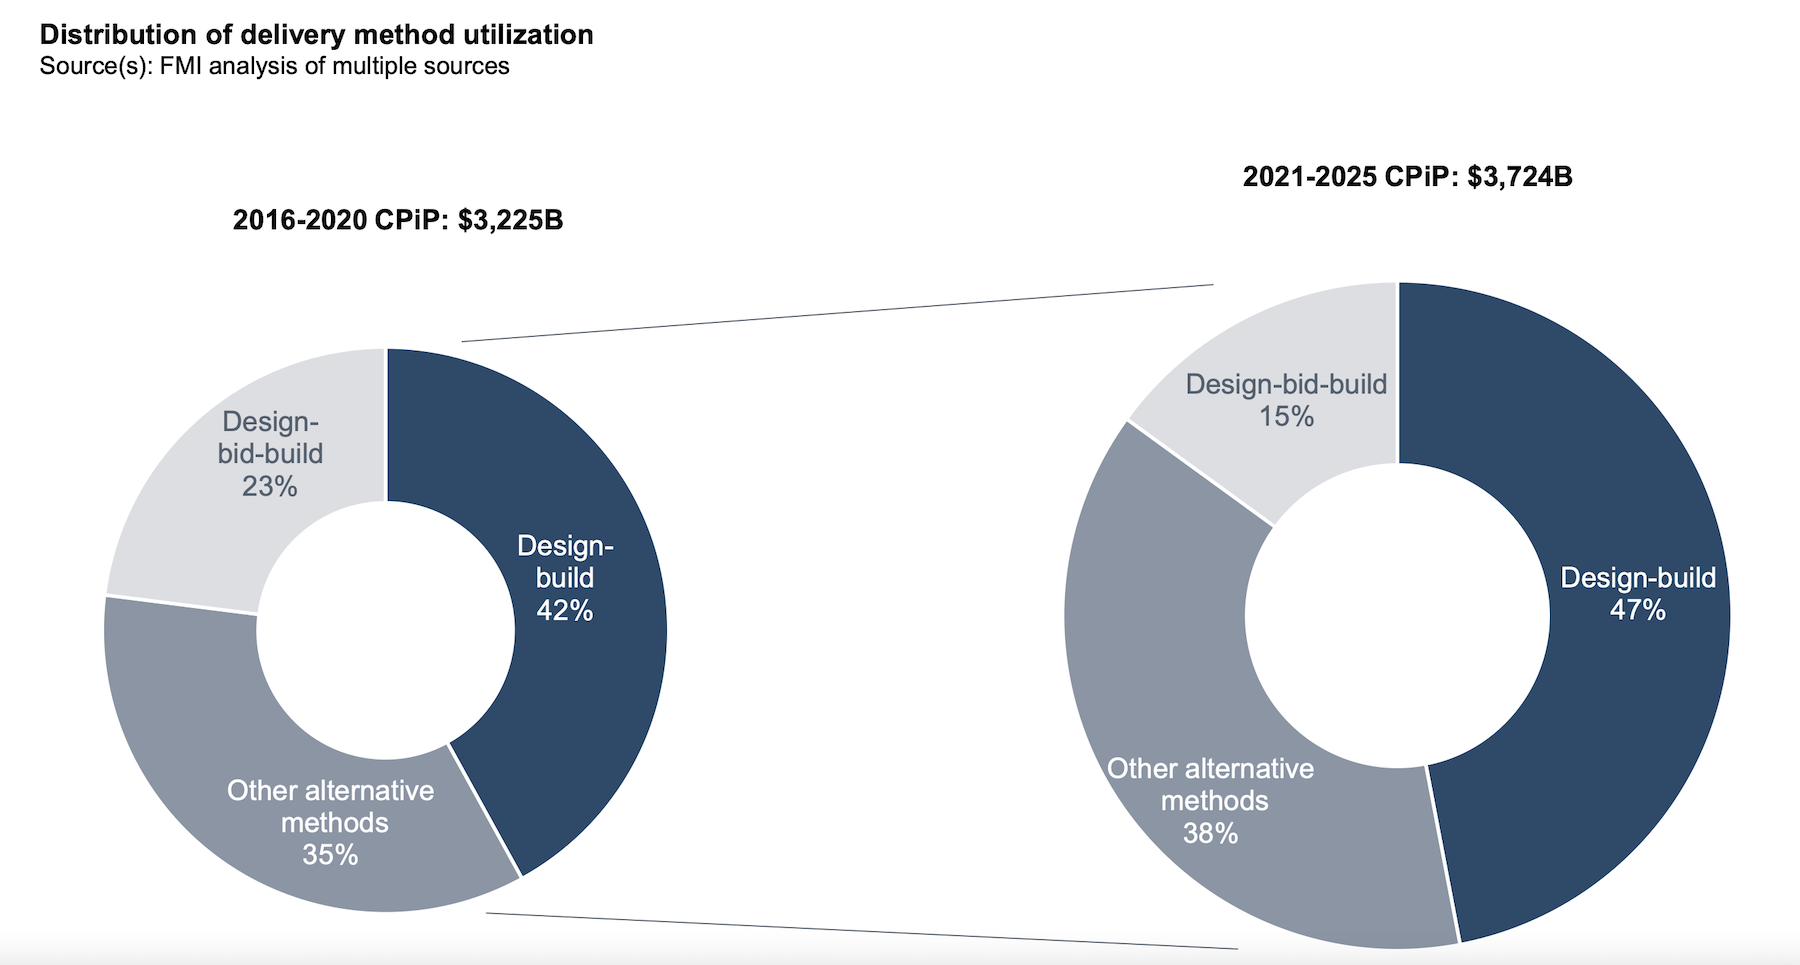
FMI’s latest report, which it releases today, forecasts that spending for design-build construction put in place will grow at a compound annual rate of 7.6% over the years 2021 through 2025, and hit $405.7 billion in 2025, or 47% of total construction spending that year, vs 42% of the total in 2021.
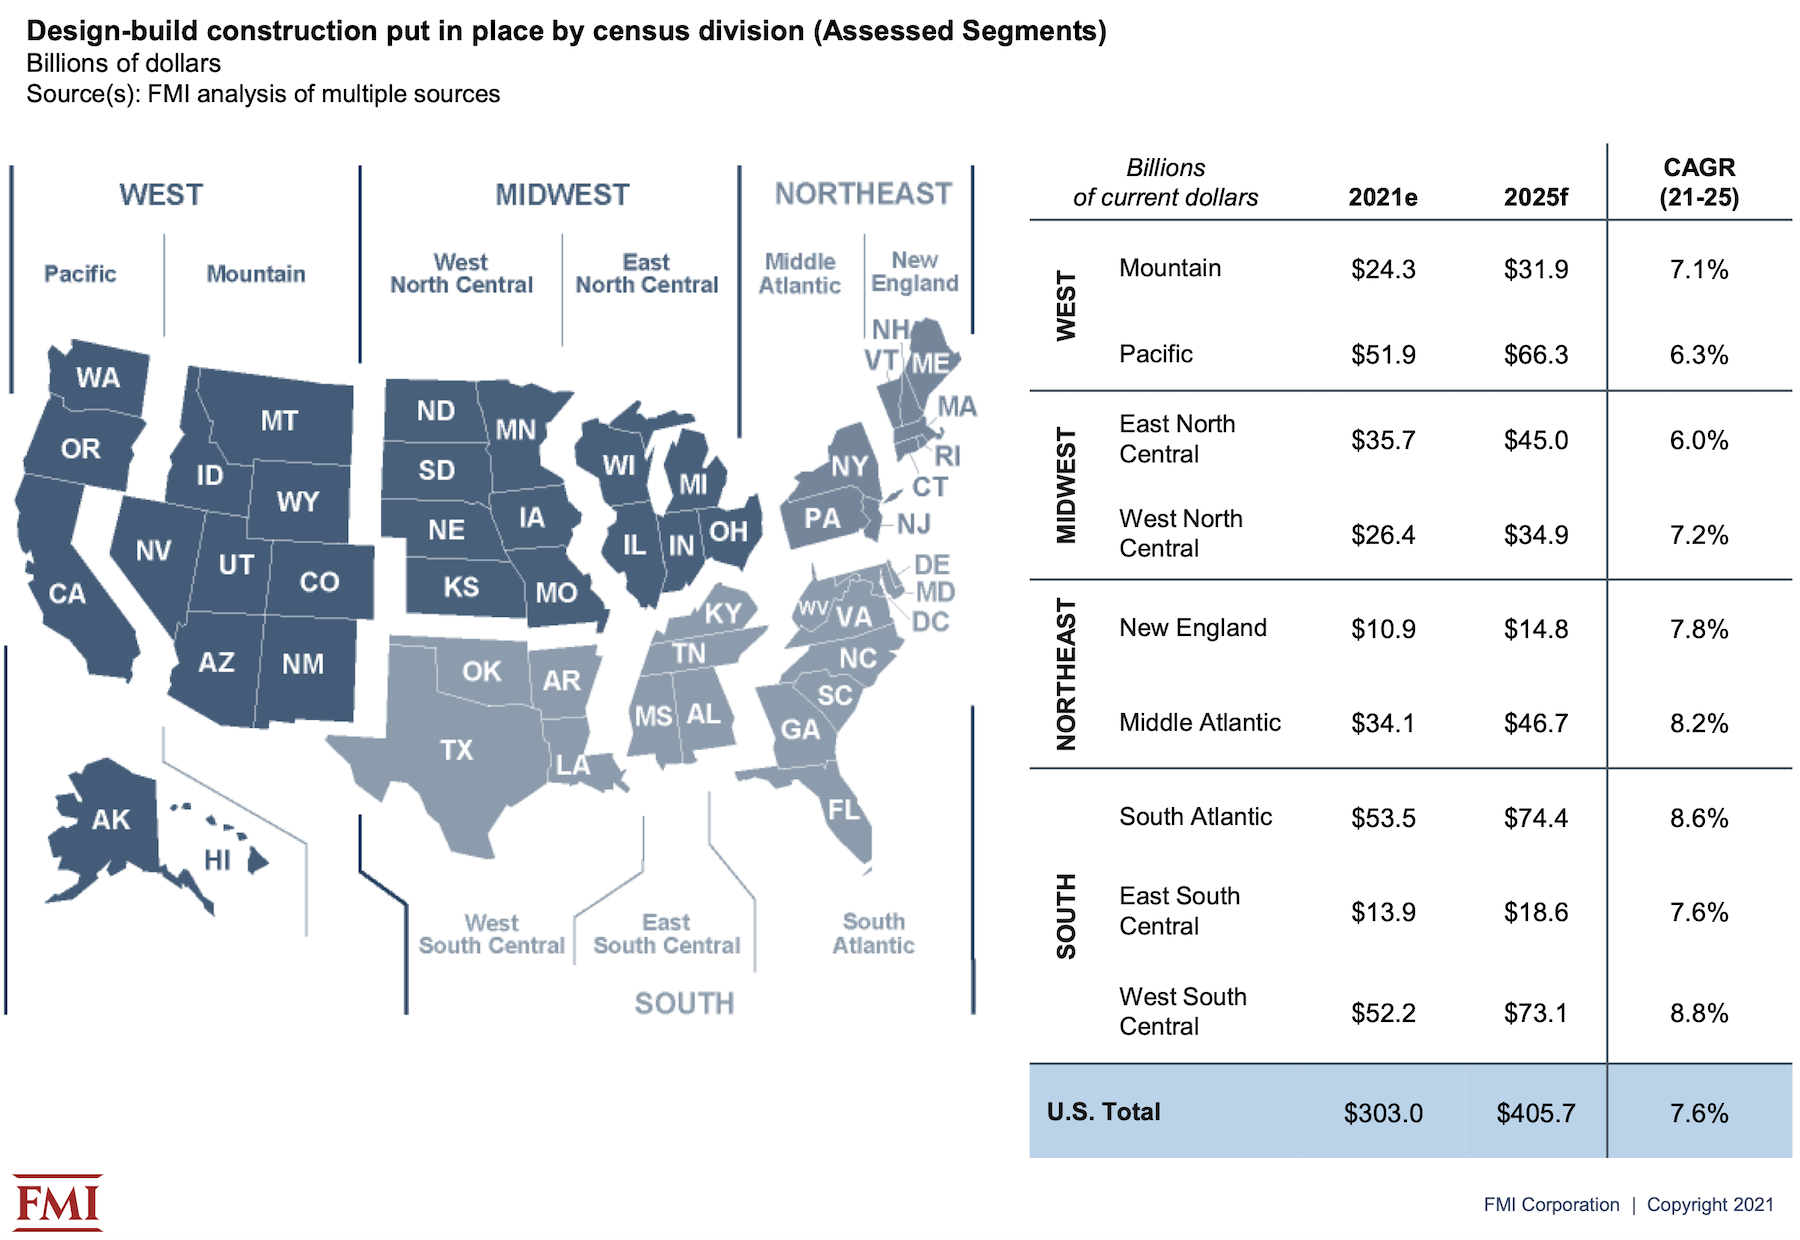
FMI expects the five-year rate of growth to be higher than the national average in the West South Central, South Atlantic, Middle Atlantic, and New England regions.
CERTAIN SECTORS MORE DISPOSED TOWARD DESIGN-BUILD
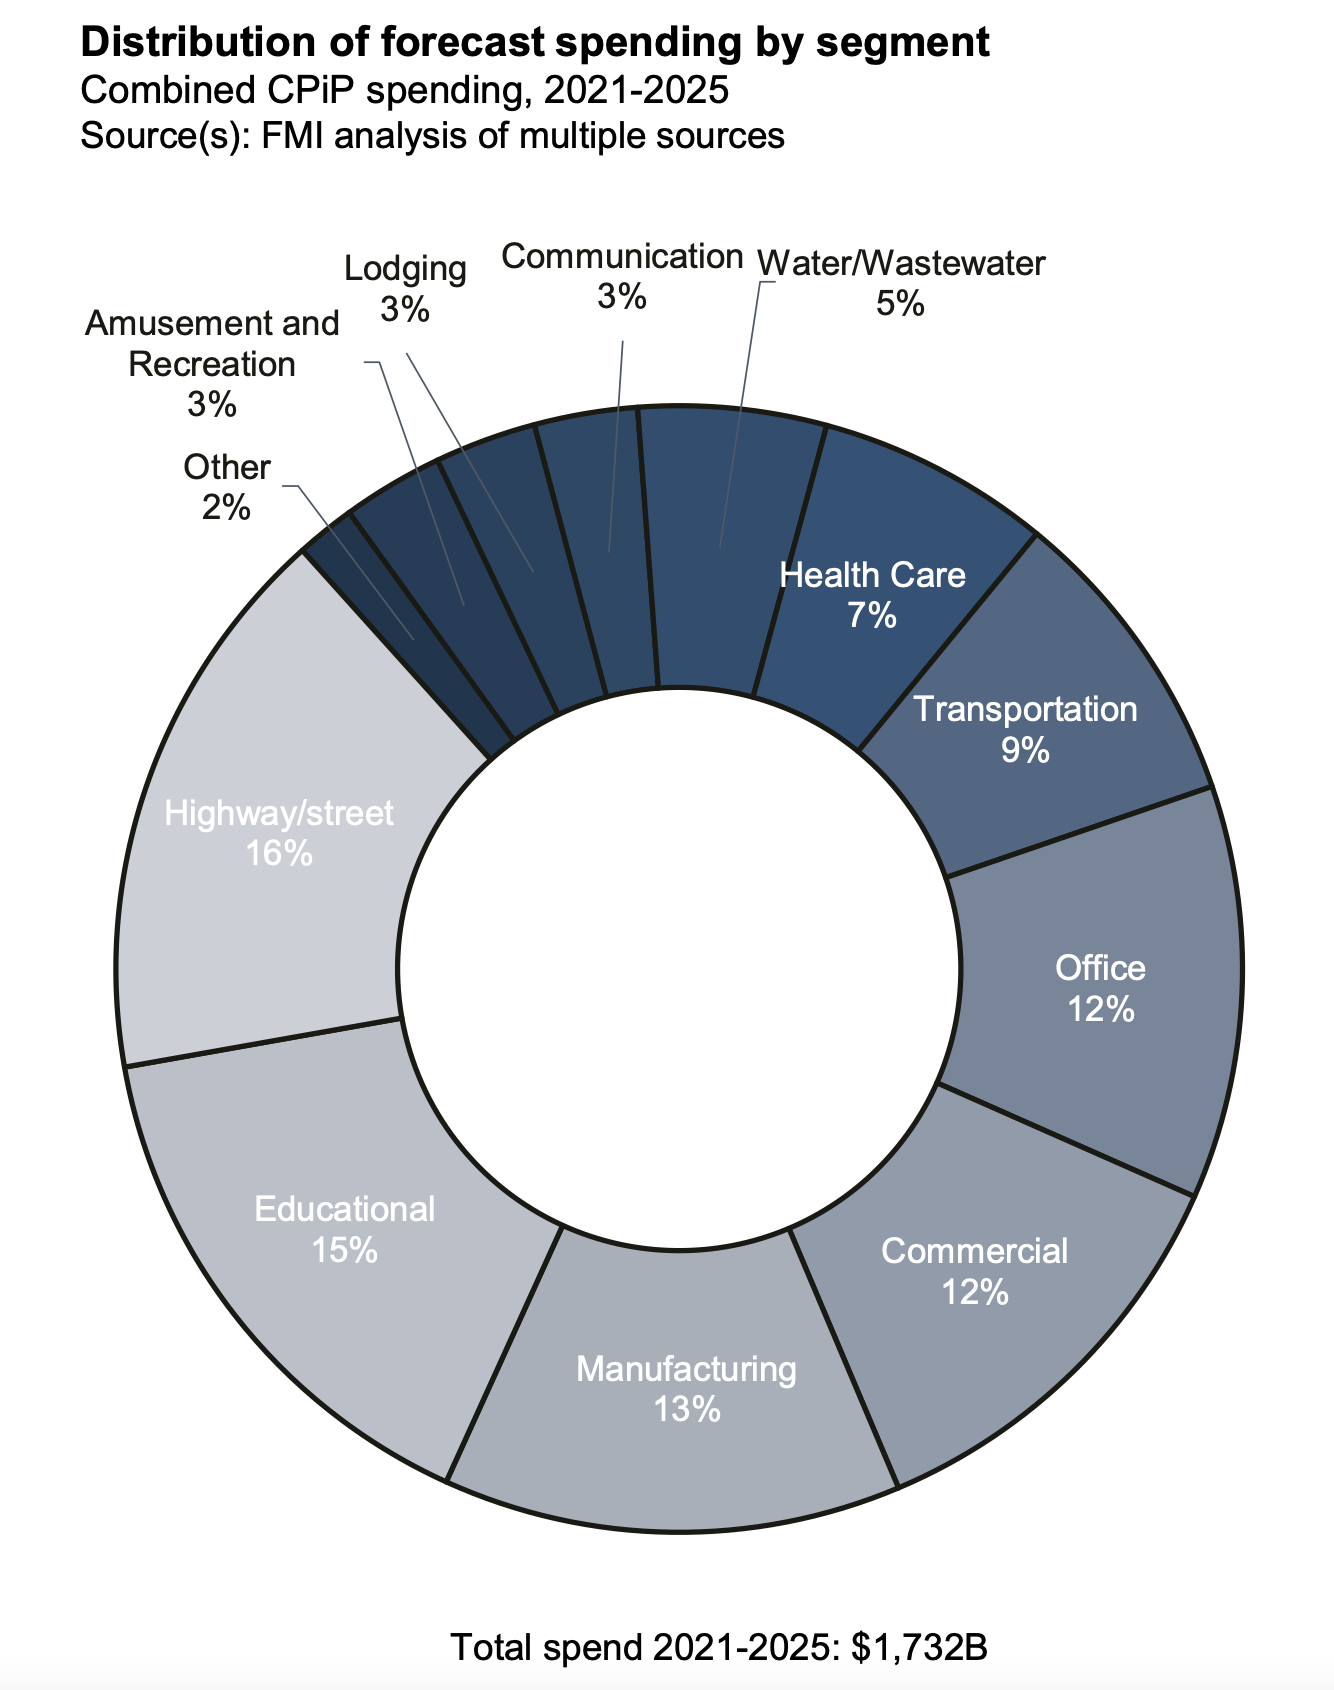
Over the forecast years, FMI estimates that the aggregate spending on projects delivered via design-build will be $1.732 trillion, or 46.2% of the $3.742 trillion spent on all construction projects. Highway and street projects will account for 16% of the design-build spending, followed by Education (15%), Manufacturing (13%) and Commercial and Office (12% each). Spending on design-build water/wastewater projects is expected to show the highest annual growth rate—11.1%—although that sector will represent only 5% of total design-build project spending over the forecast years.
Design-build rated highest across all project delivery methods, with 77% of the report’s respondents having “very good” or “excellent” experiences with the method. The 2021 study found that 60% of respondents identified “owner goals and objectives” as an influence on their choice of delivery methods, following by 50% who identified a project’s complexity and innovation, and 46% who cited “delivery schedule” or “contractor experience.”
HIGH FAVORABILITY QUOTIENT
Seventy-seven percent of the study’s respondents thought that the design-build delivery method would increase over the next five years. “We have seen significantly more design-build work,” stated one respondent quoted in the report. “Virtually everything in our geography is going design-build,” said another.
Conversely, respondents with less favorable experiences with design-build delivery noted that some owners still see this method as a way of transferring risk to the building team, and underestimate the commitment needed to make this delivery method work.
Most respondents, however, saw myriad benefits in design-build. For example, 76% of architects, designers, and engineers, and 89% of GCs and CMs, cited increased collaboration and creativity. Greater project and design control was cited by 88% of GCs/CMs and 84% of specialty trade contractors. GCs/CMs (who represented 31% of the study’s respondents) like the opportunities to innovate that design-build methods afford them, as do 90% of owner’s reps.
Nearly half—47%—of organizations that responded to FMI’s survey use fixed price/lump sum contracts for their design-build projects, compared to 39% that use guaranteed max price contracts.
Related Stories

Market Data | Apr 4, 2023
Nonresidential construction spending up 0.4% in February 2023
National nonresidential construction spending increased 0.4% in February, according to an Associated Builders and Contractors analysis of data published by the U.S. Census Bureau. On a seasonally adjusted annualized basis, nonresidential spending totaled $982.2 billion for the month, up 16.8% from the previous year.

Multifamily Housing | Mar 24, 2023
Average size of new apartments dropped sharply in 2022
The average size of new apartments in 2022 dropped sharply in 2022, as tracked by RentCafe. Across the U.S., the average new apartment size was 887 sf, down 30 sf from 2021, which was the largest year-over-year decrease.

Multifamily Housing | Mar 14, 2023
Multifamily housing rent rates remain flat in February 2023
Multifamily housing asking rents remained the same for a second straight month in February 2023, at a national average rate of $1,702, according to the new National Multifamily Report from Yardi Matrix. As the economy continues to adjust in the post-pandemic period, year-over-year growth continued its ongoing decline.

Contractors | Mar 14, 2023
The average U.S. contractor has 9.2 months worth of construction work in the pipeline, as of February 2023
Associated Builders and Contractors reported today that its Construction Backlog Indicator increased to 9.2 months in February, according to an ABC member survey conducted Feb. 20 to March 6. The reading is 1.2 months higher than in February 2022.

Industry Research | Mar 9, 2023
Construction labor gap worsens amid more funding for new infrastructure, commercial projects
The U.S. construction industry needs to attract an estimated 546,000 additional workers on top of the normal pace of hiring in 2023 to meet demand for labor, according to a model developed by Associated Builders and Contractors. The construction industry averaged more than 390,000 job openings per month in 2022.

Market Data | Mar 7, 2023
AEC employees are staying with firms that invest in their brand
Hinge Marketing’s latest survey explores workers’ reasons for leaving, and offers strategies to keep them in the fold.

Multifamily Housing | Feb 21, 2023
Multifamily housing investors favoring properties in the Sun Belt
Multifamily housing investors are gravitating toward Sun Belt markets with strong job and population growth, according to new research from Yardi Matrix. Despite a sharp second-half slowdown, last year’s nationwide $187 billion transaction volume was the second-highest annual total ever.

Contractors | Feb 14, 2023
The average U.S. contractor has nine months worth of construction work in the pipeline
Associated Builders and Contractors reports today that its Construction Backlog Indicator declined 0.2 months to 9.0 in January, according to an ABC member survey conducted Jan. 20 to Feb. 3. The reading is 1.0 month higher than in January 2022.

Office Buildings | Feb 9, 2023
Post-Covid Manhattan office market rebound gaining momentum
Office workers in Manhattan continue to return to their workplaces in sufficient numbers for many of their employers to maintain or expand their footprint in the city, according to a survey of more than 140 major Manhattan office employers conducted in January by The Partnership for New York City.

Giants 400 | Feb 9, 2023
New Giants 400 download: Get the complete at-a-glance 2022 Giants 400 rankings in Excel
See how your architecture, engineering, or construction firm stacks up against the nation's AEC Giants. For more than 45 years, the editors of Building Design+Construction have surveyed the largest AEC firms in the U.S./Canada to create the annual Giants 400 report. This year, a record 519 firms participated in the Giants 400 report. The final report includes 137 rankings across 25 building sectors and specialty categories.


