


Architecture firms continue to report increasing demand for design services in September, according to a new report today from The American Institute of Architects (AIA).
The Architecture Billings Index (ABI) score for September was 56.6, which is up from August’s score of 55.6. Any score above 50 indicates an increase in billings from the prior month. During September, scoring for both the new project inquiries and design contracts moderated slightly, but remained in positive territory, posting scores of 61.8 and 54.7 respectively.
“The ABI scores over the last eight months continue to be among the highest ever seen in the immediate post-recession periods that have been captured throughout the index’s history,” said AIA Chief Economist, Kermit Baker, Hon. AIA, PhD. “However, it’s unlikely that revenue increases at architecture firms can sustain this pace. Given that growth in both new design contracts and project inquiries have moderated in recent months, we expect to see a similar path for the ABI.”
Key ABI highlights for September include:
• Regional averages: Midwest (57.7); South (57.0); West (56.0); Northeast (51.5)
• Sector index breakdown: mixed practice (58.8); commercial/industrial (58.1); multi-family residential (56.1); institutional (53.5)
The regional and sector categories are calculated as a three-month moving average, whereas the national index, design contracts and inquiries are monthly numbers.
Visit AIA’s website for more ABI information.
Related Stories
Market Data | Aug 2, 2018
Nonresidential construction spending dips in June
“The hope is that June’s construction spending setback is merely a statistical aberration,” said ABC Chief Economist Anirban Basu.

Market Data | Aug 1, 2018
U.S. hotel construction pipeline continues moderate growth year-over-year
The hotel construction pipeline has been growing moderately and incrementally each quarter.
Market Data | Jul 30, 2018
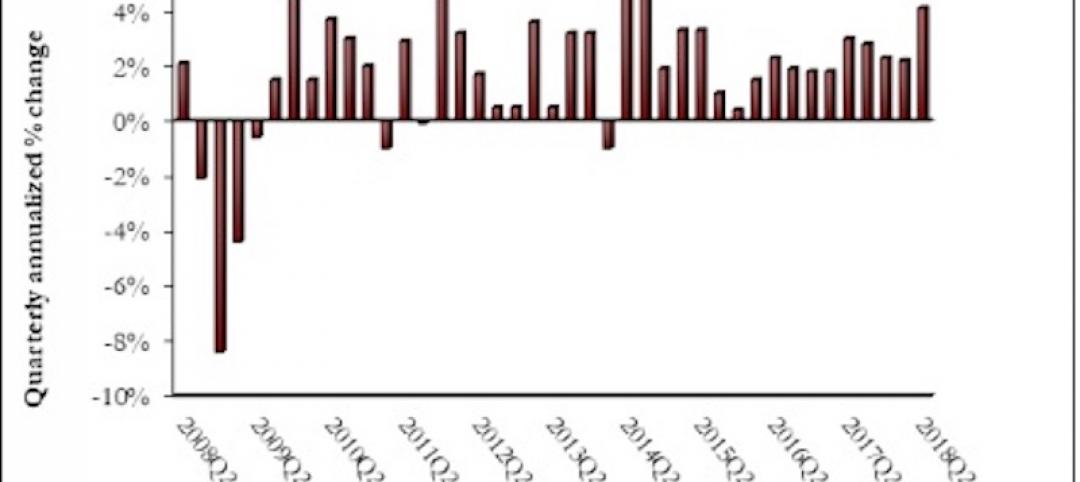
Nonresidential fixed investment surges in second quarter
Nonresidential fixed investment represented an especially important element of second quarter strength in the advance estimate.

Market Data | Jul 11, 2018
Construction material prices increase steadily in June
June represents the latest month associated with rapidly rising construction input prices.

Market Data | Jun 26, 2018
Yardi Matrix examines potential regional multifamily supply overload
Outsize development activity in some major metros could increase vacancy rates and stagnate rent growth.

Market Data | Jun 22, 2018
Multifamily market remains healthy – Can it be sustained?
New report says strong economic fundamentals outweigh headwinds.
Market Data | Jun 21, 2018
Architecture firm billings strengthen in May
Architecture Billings Index enters eighth straight month of solid growth.

Market Data | Jun 20, 2018
7% year-over-year growth in the global construction pipeline
There are 5,952 projects/1,115,288 rooms under construction, up 8% by projects YOY.
Market Data | Jun 19, 2018
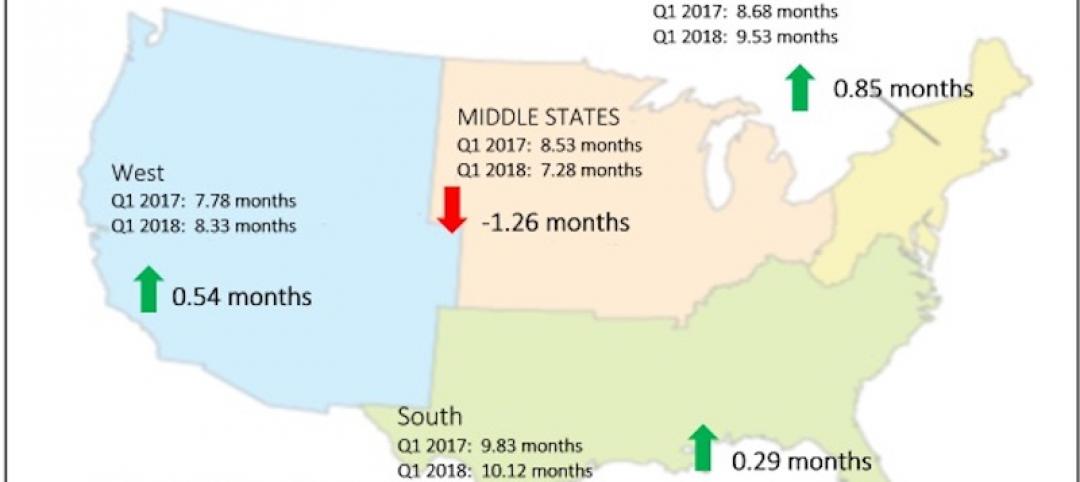
ABC’s Construction Backlog Indicator remains elevated in first quarter of 2018
The CBI shows highlights by region, industry, and company size.
Market Data | Jun 19, 2018
America’s housing market still falls short of providing affordable shelter to many
The latest report from the Joint Center for Housing Studies laments the paucity of subsidies to relieve cost burdens of ownership and renting.


