


Associated Builders and Contractors' Construction Backlog Indicator increased to 9.2 months in November, according to an ABC member survey conducted Nov. 21 to Dec. 6. The reading is 0.8 months higher than in November 2021.
The CBI is now at its highest level since the second quarter of 2019. The increase in backlog observed in November is largely attributed to contractors with under $30 million in revenue, which now have their highest level of backlog in over three years.
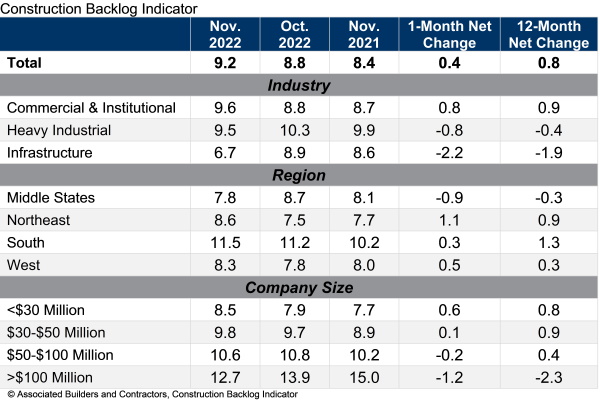
“The rise in backlog is remarkable and unexpected,” said ABC Chief Economist Anirban Basu. “A number of contractors have been reporting that their backlog has risen rapidly over the past three months, which is counterintuitive given the pervasive view that the broader economy is headed into recession.
“The improvement in backlog was particularly sharp in the commercial and institutional category, and health care-related construction has emerged as a major driver of new activity,” added Basu. “While it seems unlikely that backlog will hold up in the face of the Federal Reserve’s efforts to slow demand, many predicted that backlog would have dipped by now and that has yet to transpire. What’s more, many contractors expect sales and staffing levels to climb over the next six months, while profit margins are projected to remain stable.”
Related Stories

Market Data | May 2, 2017
Nonresidential Spending loses steam after strong start to year
Spending in the segment totaled $708.6 billion on a seasonally adjusted, annualized basis.

Market Data | May 1, 2017
Nonresidential Fixed Investment surges despite sluggish economic in first quarter
Real gross domestic product (GDP) expanded 0.7 percent on a seasonally adjusted annualized rate during the first three months of the year.

Industry Research | Apr 28, 2017
A/E Industry lacks planning, but still spending large on hiring
The average 200-person A/E Firm is spending $200,000 on hiring, and not budgeting at all.

Market Data | Apr 19, 2017
Architecture Billings Index continues to strengthen
Balanced growth results in billings gains in all regions.

Market Data | Apr 13, 2017
2016’s top 10 states for commercial development
Three new states creep into the top 10 while first and second place remain unchanged.

Market Data | Apr 6, 2017
Architecture marketing: 5 tools to measure success
We’ve identified five architecture marketing tools that will help your firm evaluate if it’s on the track to more leads, higher growth, and broader brand visibility.

Market Data | Apr 3, 2017
Public nonresidential construction spending rebounds; overall spending unchanged in February
The segment totaled $701.9 billion on a seasonally adjusted annualized rate for the month, marking the seventh consecutive month in which nonresidential spending sat above the $700 billion threshold.

Market Data | Mar 29, 2017
Contractor confidence ends 2016 down but still in positive territory
Although all three diffusion indices in the survey fell by more than five points they remain well above the threshold of 50, which signals that construction activity will continue to be one of the few significant drivers of economic growth.

Market Data | Mar 24, 2017
These are the most and least innovative states for 2017
Connecticut, Virginia, and Maryland are all in the top 10 most innovative states, but none of them were able to claim the number one spot.

Market Data | Mar 22, 2017
After a strong year, construction industry anxious about Washington’s proposed policy shifts
Impacts on labor and materials costs at issue, according to latest JLL report.


