

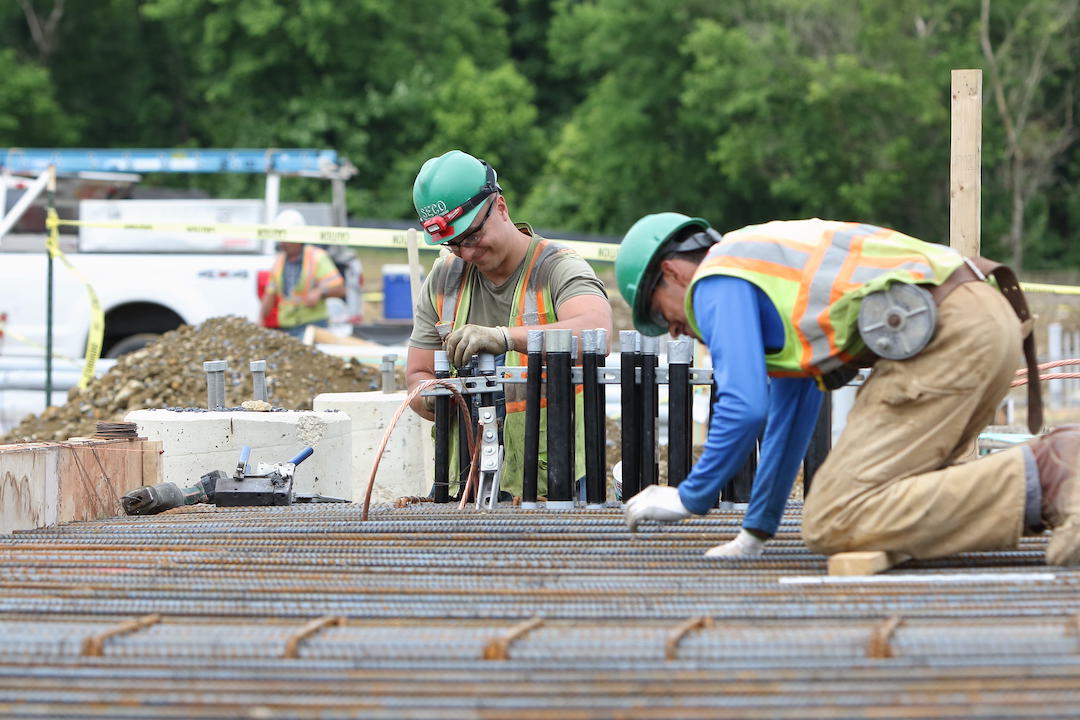
Construction spending increased in December compared to both November and a year ago thanks to growing demand for residential construction, according to an analysis of federal spending data the Associated General Contractors of America released today. Association officials noted, however, that spending on private nonresidential construction was flat for the month and down compared to a year ago while public sector construction spending fell for both the month and the year.
“Demand for new housing remains strong, while demand for nonresidential projects has been variable and most types of public sector investments in construction are declining,” said Ken Simonson, the association’s chief economist. “Contractors coping with rising materials prices and labor shortages are also dealing with the consequences of a nonresidential market that is, at best, uneven.”
Construction spending in December totaled $1.64 trillion at a seasonally adjusted annual rate, 0.2% above the November rate and 9.0% higher than in December 2020. Full-year spending for 2021 increased 8.2% compared to 2020.
Private residential construction spending rose 0.7% in December from a month prior and 12.7% from December 2020. For 2021 as a whole, residential construction spending jumped 23.2% from 2020, with gains of 32.8% for single-family spending and 15.6% for multifamily spending.
Private nonresidential construction spending was nearly unchanged from November to December but increased 9.1% from December 2020. For all of 2021, private nonresidential spending slipped 2.3% from 2020. The largest private nonresidential segment, power construction, rose 0.1% for the month and 4.9% year-over-year. Among other large segments, commercial construction--comprising warehouse, retail, and farm structures--inched up 0.1% in December and jumped 18.4% year-over-year, driven by surging demand for distribution facilities. Manufacturing construction spending fell by 1.9% in December, after 11 consecutive months of growth, but posted a 30.4% gain above its year-earlier level.
Public construction declined 1.6% in December, with decreases in 11 of the 12 categories, and 2.9% year-over-year. For 2021 as a whole, public construction fell 4.2% from 2020. Highway and street construction increased 0.1% from November and rose 0.9% compared to December 2020. Educational construction slipped 1.4% for the month and skidded 8.5% year-over-year. Transportation construction spending fell 3.0% in December and 6.3% year-over year.
Association officials said one reason for the declines in public sector construction spending is that Congress has yet to appropriate most of the additional funds authorized in the Bipartisan Infrastructure Bill signed by President Biden last year. They urged Congress to quickly make those new funds available so state and local officials can make the investments needed to improve the nation’s aging infrastructure.
“The Bipartisan Infrastructure Package’s immediate promise is not being met because Congress has yet to appropriate much of the increased funding,” said Stephen E. Sandherr, the association’s chief executive officer. “It is time to improve our infrastructure and protect those who rely on it.”
Related Stories
Green | Jan 31, 2018
U.S. Green Building Council releases annual top 10 states for LEED green building per capita
Massachusetts tops the list for the second year; New York, Hawaii and Illinois showcase leadership in geographically diverse locations.

Industry Research | Jan 30, 2018
AIA’s Kermit Baker: Five signs of an impending upturn in construction spending
Tax reform implications and rebuilding from natural disasters are among the reasons AIA’s Chief Economist is optimistic for 2018 and 2019.

Market Data | Jan 30, 2018
AIA Consensus Forecast: 4.0% growth for nonresidential construction spending in 2018
The commercial office and retail sectors will lead the way in 2018, with a strong bounce back for education and healthcare.

Market Data | Jan 29, 2018
Year-end data show economy expanded in 2017; Fixed investment surged in fourth quarter
The economy expanded at an annual rate of 2.6% during the fourth quarter of 2017.

Market Data | Jan 25, 2018
Renters are the majority in 42 U.S. cities
Over the past 10 years, the number of renters has increased by 23 million.

Market Data | Jan 24, 2018
HomeUnion names the most and least affordable rental housing markets
Chicago tops the list as the most affordable U.S. metro, while Oakland, Calif., is the most expensive rental market.

Market Data | Jan 12, 2018
Construction input prices inch down in December, Up YOY despite low inflation
Energy prices have been more volatile lately.

Market Data | Jan 4, 2018
Nonresidential construction spending ticks higher in November, down year-over-year
Despite the month-over-month expansion, nonresidential spending fell 1.3 percent from November 2016.

Contractors | Jan 4, 2018
Construction spending in a ‘mature’ period of incremental growth
Labor shortages are spiking wages. Materials costs are rising, too.
 reported the November ABI score was 55.0, up from a score of 51.7 in the previous month. Photo: Pixabay")
Market Data | Dec 20, 2017
Architecture billings upturn shows broad strength
The American Institute of Architects (AIA) reported the November ABI score was 55.0, up from a score of 51.7 in the previous month.


