


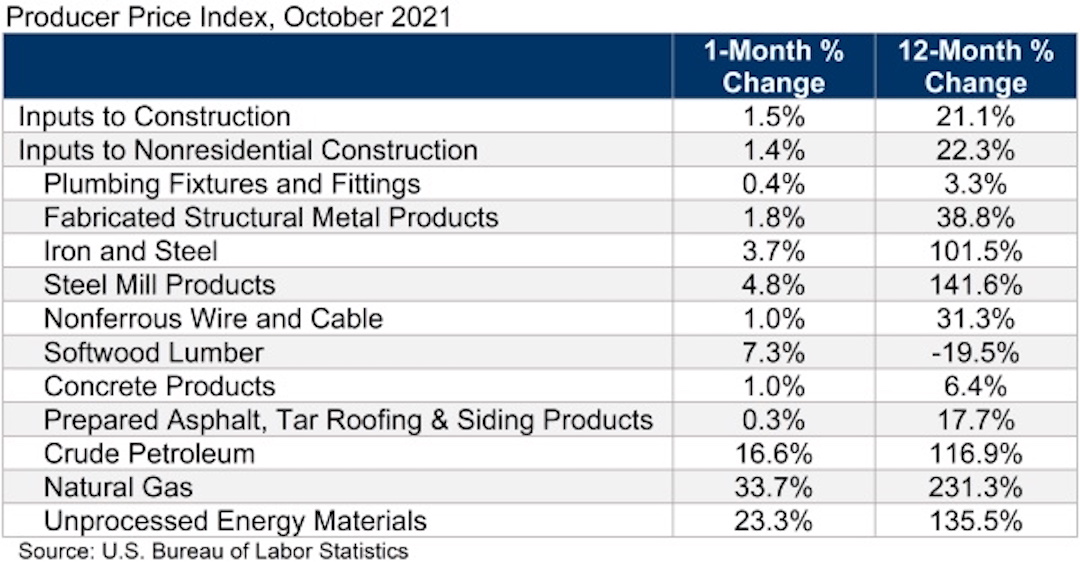
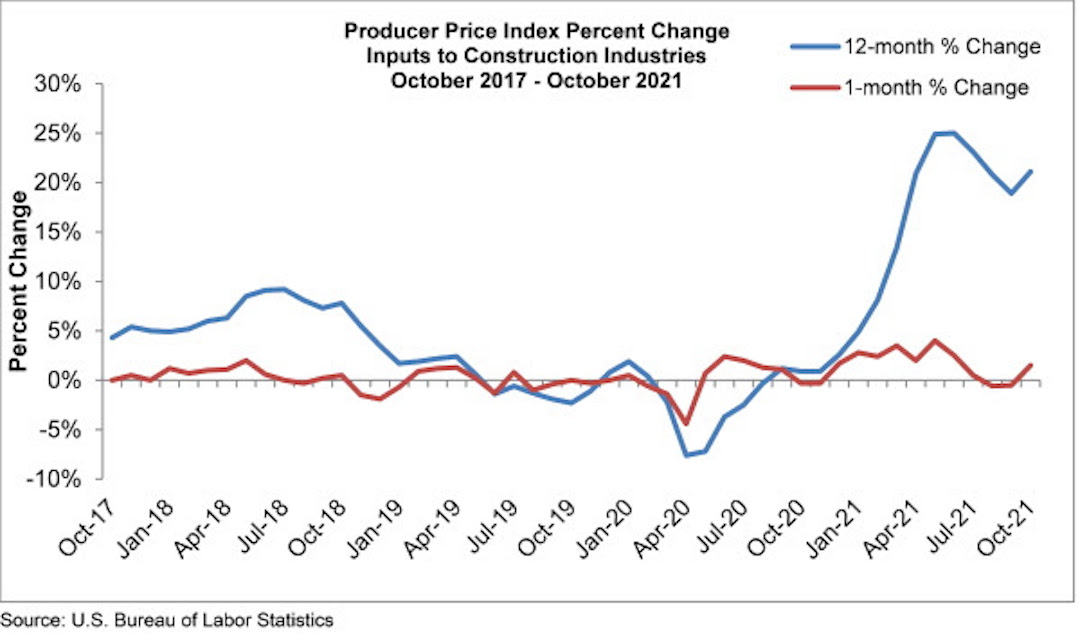
Construction input prices increased 1.5% in October, according to an Associated Builders and Contractors analysis of the U.S. Bureau of Labor Statistics’ Producer Price Index data released today. Nonresidential construction input prices increased 1.4% for the month.
Construction input prices are 21.1% higher than in October 2020, while nonresidential construction input prices increased 22.3% over that span. Steel mill product prices have increased 141.6% since October 2020, while iron and steel prices are up 101.5%. Softwood lumber prices, which surged during the pandemic, are now down 19.5% from the same time last year.
“Any notion that the bout of pandemic-induced inflation was simply transitory has gone by the wayside,” said ABC Chief Economist Anirban Basu. “Inflation continues to endure, particularly in multiple commodity categories that directly impact the cost of delivering construction services in America. These materials price increases are simply mind-boggling, with iron and steel prices up more than 100% over the past year.
“Despite increased vaccination levels, global supply chain disruptions persist,” said Basu. “Contractors should expect elevated prices well into 2022. According to ABC’s most recent Construction Confidence Index, the average contractor expects profits to decline over the next six months as the combination of high materials prices and an ongoing shortage of workers conspires to put pressure on margins."
Related Stories

Market Data | Mar 29, 2017
Contractor confidence ends 2016 down but still in positive territory
Although all three diffusion indices in the survey fell by more than five points they remain well above the threshold of 50, which signals that construction activity will continue to be one of the few significant drivers of economic growth.

Market Data | Mar 24, 2017
These are the most and least innovative states for 2017
Connecticut, Virginia, and Maryland are all in the top 10 most innovative states, but none of them were able to claim the number one spot.

Market Data | Mar 22, 2017
After a strong year, construction industry anxious about Washington’s proposed policy shifts
Impacts on labor and materials costs at issue, according to latest JLL report.

Market Data | Mar 22, 2017
Architecture Billings Index rebounds into positive territory
Business conditions projected to solidify moving into the spring and summer.

Market Data | Mar 15, 2017
ABC's Construction Backlog Indicator fell to end 2016
Contractors in each segment surveyed all saw lower backlog during the fourth quarter, with firms in the heavy industrial segment experiencing the largest drop.

Market Data | Feb 28, 2017
Leopardo’s 2017 Construction Economics Report shows year-over-year construction spending increase of 4.2%
The pace of growth was slower than in 2015, however.

Market Data | Feb 23, 2017
Entering 2017, architecture billings slip modestly
Despite minor slowdown in overall billings, commercial/ industrial and institutional sectors post strongest gains in over 12 months.

Market Data | Feb 16, 2017
How does your hospital stack up? Grumman/Butkus Associates 2016 Hospital Benchmarking Survey
Report examines electricity, fossil fuel, water/sewer, and carbon footprint.

Market Data | Feb 1, 2017
Nonresidential spending falters slightly to end 2016
Nonresidential spending decreased from $713.1 billion in November to $708.2 billion in December.

Market Data | Jan 31, 2017
AIA foresees nonres building spending increasing, but at a slower pace than in 2016
Expects another double-digit growth year for office construction, but a more modest uptick for health-related building.


