

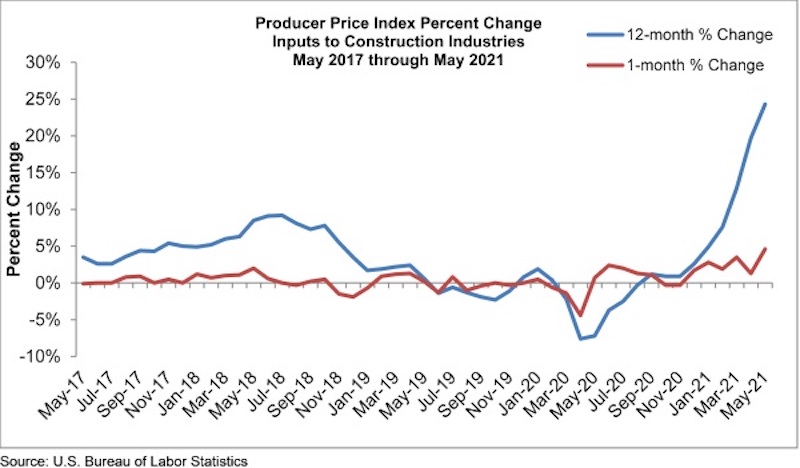
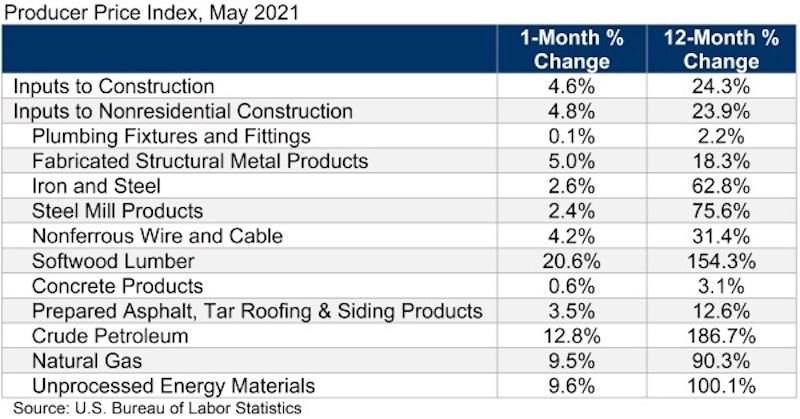
Construction input prices increased 4.6% in May compared to the previous month, according to an Associated Builders and Contractors analysis of U.S. Bureau of Labor Statistics’ Producer Price Index data released today. Nonresidential construction input prices increased 4.8% for the month.
Construction input prices are 24.3% higher than a year ago, while nonresidential construction input prices increased 23.9% over that span. Similar to last month, all three energy subcategories registered significant year-over-year price increases. Crude petroleum has risen 187%, while the prices of unprocessed energy materials and natural gas have increased 100% and 90%, respectively. The price of softwood lumber has expanded 154% over the past year.
“The specter of elevated construction input prices will not end anytime soon,” said ABC Chief Economic Anirban Basu. “While global supply chains should become more orderly over time as the pandemic fades into memory, global demand for inputs will be overwhelming as the global economy comes back to life. Domestically, contractors expect sales to rise over the next six months, as indicated by ABC’s Construction Confidence Index. This means that project owners who delayed the onset of construction for a few months in order to secure lower bids may come to regret that decision.
“Many economists continue to believe that the surge in prices is temporary, the result of an economic reopening shock,” said Basu. “To a large extent, they are correct. The cure for high prices is high prices. When prices are elevated, suppliers have greater incentive to boost capacity and bolster output. That dynamic eventually results in a downward shift in prices. Operations at input producers should also become smoother over time as staff is brought back and standard operating procedures are reestablished.
“Still, there are some things that have changed during the pandemic and will not shift back,” said Basu. “For instance, money supply around the world has expanded significantly. Governments have been running large deficits. This means that some of the inflationary pressure that contractors and others are experiencing may not be temporary, and that inflation and interest rates may not be as low during the decade ahead as they were during the decade leading up to the pandemic.”

Related Stories

Engineers | May 3, 2017
At first buoyed by Trump election, U.S. engineers now less optimistic about markets, new survey shows
The first quarter 2017 (Q1/17) of ACEC’s Engineering Business Index (EBI) dipped slightly (0.5 points) to 66.0.

Market Data | May 2, 2017
Nonresidential Spending loses steam after strong start to year
Spending in the segment totaled $708.6 billion on a seasonally adjusted, annualized basis.

Market Data | May 1, 2017
Nonresidential Fixed Investment surges despite sluggish economic in first quarter
Real gross domestic product (GDP) expanded 0.7 percent on a seasonally adjusted annualized rate during the first three months of the year.

Industry Research | Apr 28, 2017
A/E Industry lacks planning, but still spending large on hiring
The average 200-person A/E Firm is spending $200,000 on hiring, and not budgeting at all.

Market Data | Apr 19, 2017
Architecture Billings Index continues to strengthen
Balanced growth results in billings gains in all regions.

Market Data | Apr 13, 2017
2016’s top 10 states for commercial development
Three new states creep into the top 10 while first and second place remain unchanged.

Market Data | Apr 6, 2017
Architecture marketing: 5 tools to measure success
We’ve identified five architecture marketing tools that will help your firm evaluate if it’s on the track to more leads, higher growth, and broader brand visibility.

Market Data | Apr 3, 2017
Public nonresidential construction spending rebounds; overall spending unchanged in February
The segment totaled $701.9 billion on a seasonally adjusted annualized rate for the month, marking the seventh consecutive month in which nonresidential spending sat above the $700 billion threshold.

Market Data | Mar 29, 2017
Contractor confidence ends 2016 down but still in positive territory
Although all three diffusion indices in the survey fell by more than five points they remain well above the threshold of 50, which signals that construction activity will continue to be one of the few significant drivers of economic growth.

Market Data | Mar 24, 2017
These are the most and least innovative states for 2017
Connecticut, Virginia, and Maryland are all in the top 10 most innovative states, but none of them were able to claim the number one spot.


