

Construction employment declined in 91 metro areas and was stagnant in another 24 between February 2020, the last month before the pandemic, and May 2021, according to an analysis by the Associated General Contractors of America of government employment data released today. They said the high number of metro areas losing construction jobs during that time frame reflected the impacts of early pandemic shutdowns and more recent challenges procuring construction materials and finding qualified workers to hire.
“The devastating job losses of early 2020 and more recent materials and labor challenges since then have kept industry employment stagnant or lower this May than in February 2020 in nearly one-third of metros,” said Ken Simonson, the association’s chief economist. “Extreme lead times for producing and delivering materials, along with record prices for many items, has led to project delays and cancellations that have chilled hiring.”
Of the 91 metro areas with lower construction employment in May 2021 than in February 2020, Houston-The Woodlands-Sugar Land, Texas lost the most jobs: 30,500 or 13%. Major losses also occurred in New York City (-21,200 jobs, -13%); Midland, Texas (-9,600 jobs, -25%) and Odessa, Texas (-8,300 jobs, -40%). Odessa had the largest percentage decline, followed by Lake Charles, La. (-36%, -7,200 jobs); Midland; Laredo, Texas (-23%, -900 jobs) and Longview, Texas (-22%, -3,300 jobs).
Construction employment increased in 243 metro areas compared to the February 2020 level—far fewer than the 320 metros that typically add construction jobs between February and May, Simonson noted. Minneapolis-St. Paul-Bloomington, Minn.-Wis. added the most construction jobs over 15 months (11,100 jobs, 14%), followed by Indianapolis-Carmel-Anderson, Ind. (10,900 jobs, 21%); Chicago-Naperville-Arlington Heights, Ill. (10,300 jobs, 9%); Seattle-Bellevue-Everett, Wash. (6,900 jobs, 7%); and Pittsburgh, Pa. (6,900 jobs, 12%). Fargo, N.D.-Minn. had the highest percentage increase (45%, 3,300 jobs), followed by Sierra Vista-Douglas, Ariz. (44%, 1,100 jobs); and Bay City, Mich. (36%, 400 jobs).
Association officials said that many construction firms report challenges with rising materials prices, supply chain problems that are leading to delivery delays for key components and challenges finding qualified labor to hire. They urged the Biden administration and Congress to work together to remove tariffs on key construction materials, ease supply chain shortages and boost investments in career and technical education. They added that the association posted an updated Construction Inflation Alert to inform owners and officials about the worsening problems with rising materials costs, shipping delays and labor shortages.
“It is hard for the construction industry to grow while firms struggle to pay for and source key materials and have a hard time finding qualified workers to hire,” said Stephen E. Sandherr, the association’s chief executive officer. “Federal officials can help the industry and boost the economy by removing tariffs, easing supply chain backups and investing in workforce development.”
View the metro employment data, rankings, top 10, multi-division metros, and map. View the Alert.
Related Stories

Market Data | Jun 3, 2019
Nonresidential construction spending up 6.4% year over year in April
Among the 16 sectors tracked by the U.S. Census Bureau, nine experienced an increase in monthly spending, led by water supply and highway and street.

Market Data | Jun 3, 2019
4.1% annual growth in office asking rents above five-year compound annual growth rate
Market has experienced no change in office vacancy rates in three quarters.

Market Data | May 30, 2019
Construction employment increases in 250 out of 358 metros from April 2018 to April 2019
Demand for work is outpacing the supply of workers.
Market Data | May 24, 2019
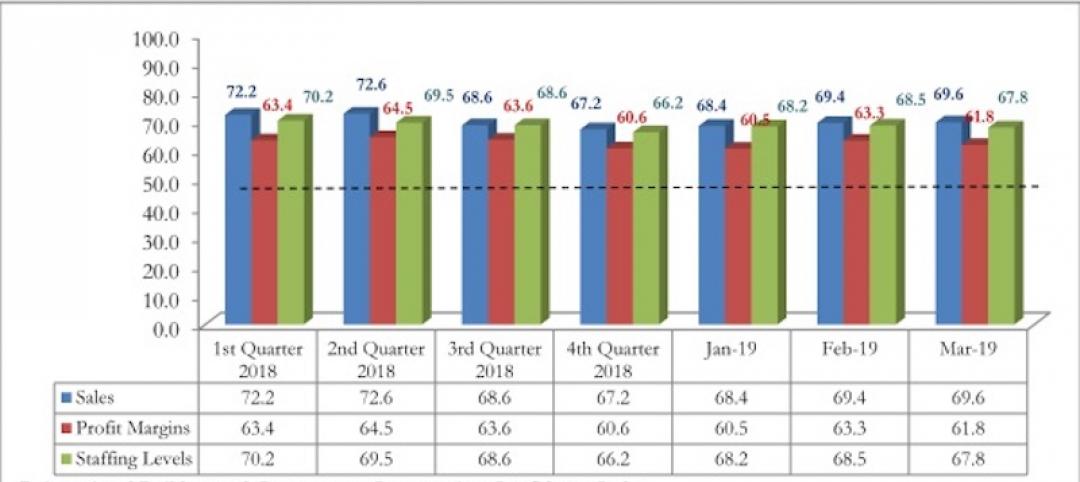
Construction contractors confidence remains high in March
More than 70% of contractors expect to increase staffing levels over the next six months.
Market Data | May 22, 2019
Slight rebound for architecture billings in April
AIA’s ABI score for April showed a small increase in design services at 50.5 in April.

Market Data | May 9, 2019
The U.S. hotel construction pipeline continues to grow in the first quarter as the economy shows surprising strength
Projects currently under construction stand at 1,709 projects/227,924 rooms.
Market Data | May 9, 2019
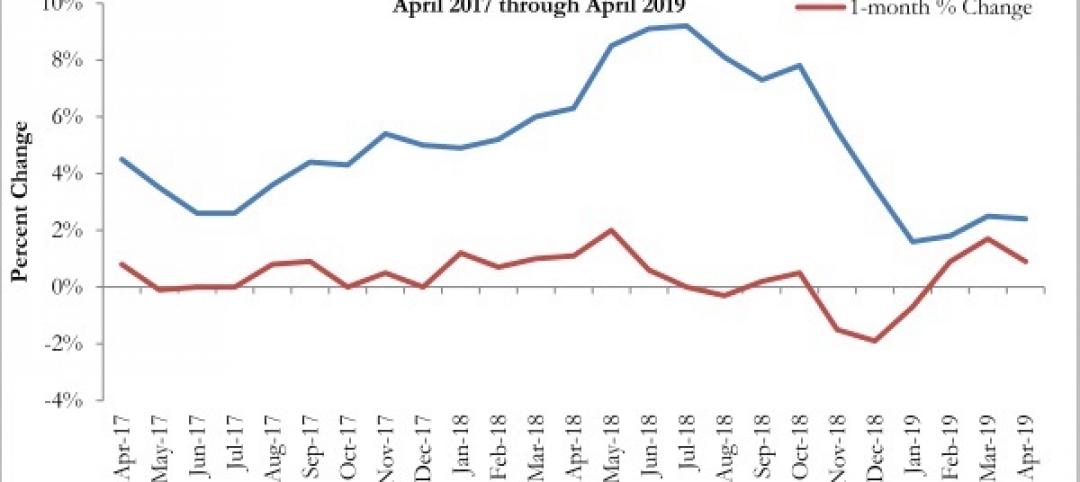
Construction input prices continue to rise
Nonresidential input prices rose 0.9% compared to March and are up 2.8% on an annual basis.
Market Data | May 7, 2019
Construction costs in major metros continued to climb last year
Latest Rider Levett Bucknall report estimates rise at more than double the rate of 2018 Growth Domestic Product.
Market Data | Apr 29, 2019
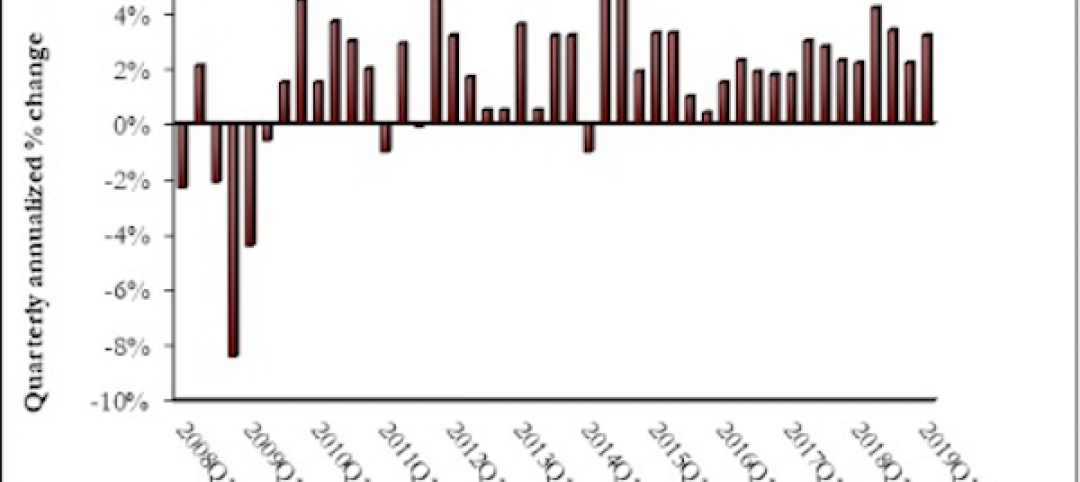
U.S. economic growth crosses 3% threshold to begin the year
Growth was fueled by myriad factors, including personal consumption expenditures, private inventory investment, surprisingly rapid growth in exports, state and local government spending and intellectual property.

Market Data | Apr 18, 2019
ABC report: 'Confidence seems to be making a comeback in America'
The Construction Confidence Index remained strong in February, according to the Associated Builders and Contractors.


