

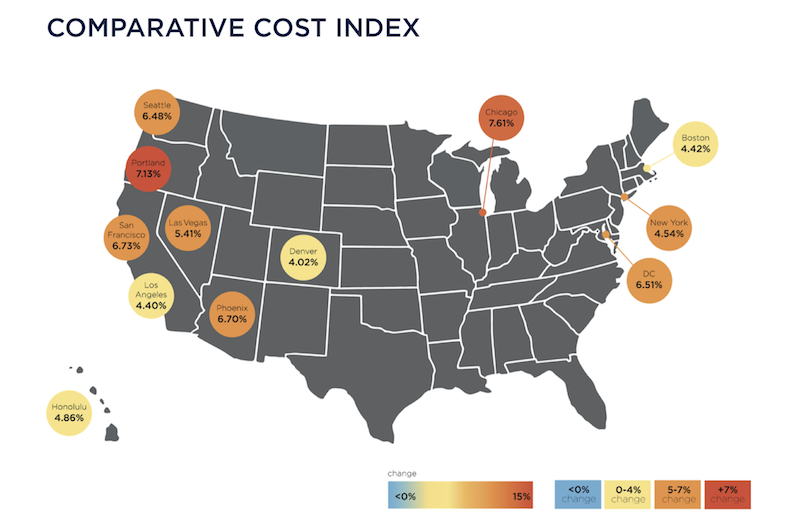
Construction costs nationally rose in 2018 by an average of 5.73%, with Chicago and Portland, Ore., showing the greatest increases among major cities.
Costs rose at a time when many markets are at or near their construction-activity cycle, and as industry unemployment remained higher than the country’s at large.
Those are two findings in the latest Quarterly Construction Cost Report for North America, released by the property and construction consultant Rider Levett Bucknall (RLB), and based on an analysis of 15 building typologies in 14 metros. (The sectors analyzed include single- and multifamily housing, as well as parking structures.)
The full quarterly report can be accessed here.
The U.S. Department of Commerce estimates that, as of January 2019, the seasonally adjusted annual rate for Construction Put-in-Place was just under $1.28 trillion, 0.3% above the same monthly estimate a year earlier.
However, the National Construction Cost Index has been on a fairly steady upward trajectory since the first quarter of 2014. As of the first quarter of 2019, that Index stood at 198.33 (relative to the April 2001 base of 100, recalibrated as of April 2011).
Some examples of RLB’s findings include its estimate that the cost of building prime office space is highest in Boston and New York, lowest in Phoenix and Denver. Los Angeles has the highest construction costs for hospitals, and Las Vegas the lowest for elementary schools.
Eight of the 14 markets analyzed were at their construction-activity peaks by the end of last year. Chicago’s construction costs, in general, increased the most (7.61%, to $22.8 billion) among the metros analyzed, even though it was the only city that fell into the “mid decline” category for construction activity. Honolulu, the only city in “trough growth,” saw construction costs rise by 4.86% to $24.8 billion.
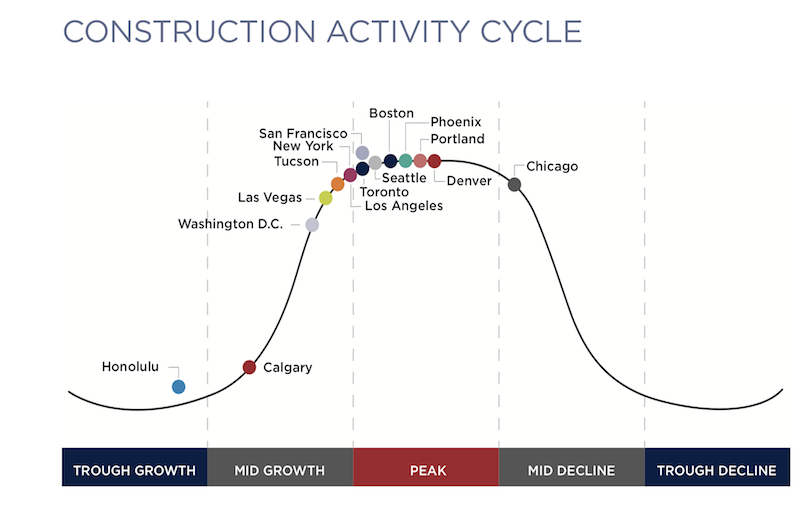 Eight of the 14 metros tracked are at the top of their constuction cycles. Image: RLB
San Francisco had the highest construction put-in-place, $26.844 billion, up 6.73%.
Increasingly expensive construction activity occurred despite a decrease in architectural billings, and an industry unemployment rate that, at 5.1% in the fourth quarter of last year, was down from 7.4% in the first quarter of 2018.
The U.S. Gross Domestic Product closed out the fourth quarter at 2.6%, down from a mid-year peak of 4.2%. Inflation last year was up only 1.91%.
The report also analyzes construction costs in Canada, specifically Calgary, Alberta, and Toronto, Ontario. RLB notes that those two cities are driving much of the growth in Canada’s economy.
Related Stories

Market Data | Nov 30, 2016
Marcum Commercial Construction Index reports industry outlook has shifted; more change expected
Overall nonresidential construction spending in September totaled $690.5 billion, down a slight 0.7 percent from a year earlier.

Industry Research | Nov 30, 2016
Multifamily millennials: Here is what millennial renters want in 2017
It’s all about technology and convenience when it comes to the things millennial renters value most in a multifamily facility.
Market Data | Nov 29, 2016
It’s not just traditional infrastructure that requires investment
A national survey finds strong support for essential community buildings.

Industry Research | Nov 28, 2016
Building America: The Merit Shop Scorecard
ABC releases state rankings on policies affecting construction industry.

Multifamily Housing | Nov 28, 2016
Axiometrics predicts apartment deliveries will peak by mid 2017
New York is projected to lead the nation next year, thanks to construction delays in 2016

Market Data | Nov 22, 2016
Construction activity will slow next year: JLL
Risk, labor, and technology are impacting what gets built.

Market Data | Nov 17, 2016
Architecture Billings Index rebounds after two down months
Decline in new design contracts suggests volatility in design activity to persist.

Market Data | Nov 11, 2016
Brand marketing: Why the B2B world needs to embrace consumers
The relevance of brand recognition has always been debatable in the B2B universe. With notable exceptions like BASF, few manufacturers or industry groups see value in generating top-of-mind awareness for their products and services with consumers.

Industry Research | Nov 8, 2016
Austin, Texas wins ‘Top City’ in the Emerging Trends in Real Estate outlook
Austin was followed on the list by Dallas/Fort Worth, Texas and Portland, Ore.

Market Data | Nov 2, 2016
Nonresidential construction spending down in September, but August data upwardly revised
The government revised the August nonresidential construction spending estimate from $686.6 billion to $696.6 billion.


