


Through April of this year, the national average increase in construction cost was 4.48%, annualized. Construction put in place during April 2019, at a seasonally adjusted annualized rate of $1.299 trillion, was 1.2% below construction put in place in April 2018.
In its just-released second quarter Construction Cost Report for North America, which is based on data from a dozen U.S. markets ansdn two Canadian markets, the construction management consultant Rider Levett Bucknall reiterates the financial and time impacts that the shortage of qualified trade workers is having on the construction industry’s productivity and expansion.
“Even as technology transforms the jobsite, improving both efficiency and worker safety, skilled-labor recruitment and retention are essential to the future of construction,” writes Julian Anderson, FRICS, Rider Levett Bucknall’s President-North America. “As worker shortage makes projects more costly and slower to build, the risk of undermining broader economic growth increases.”
RLB’s National Construction Cost Index stood at 200.55 in the second quarter of 2019, up from 189.8 in the same quarter a year earlier, and 182.16 in Q2 2017. Keep in mind that these increases are occurring at a time when there has been relatively little inflation in the economy.

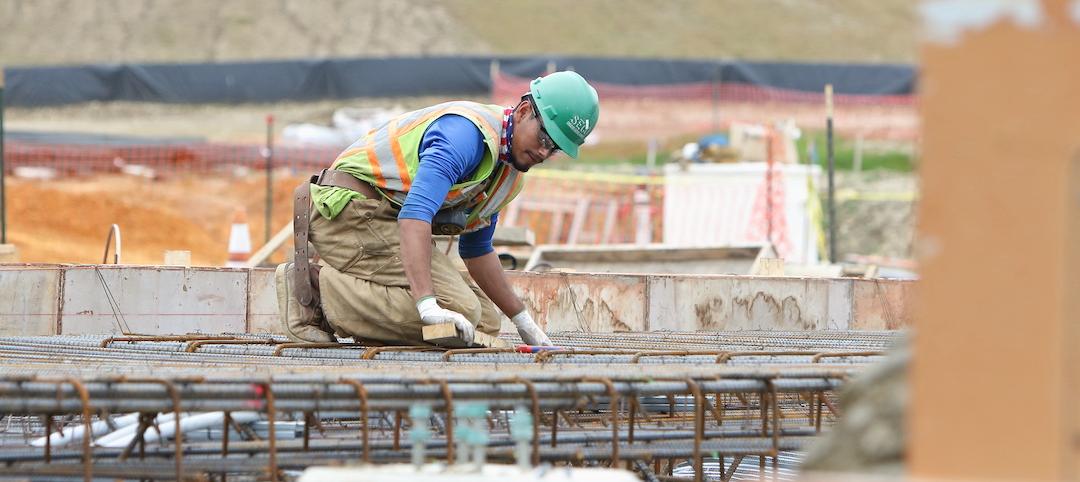
The construction backlog in North America was more than nine months in the second quarter. Image: Rider Levett Bucknall, from Associated Builders and Contractors estimates.
RLB's estimates are in line Turner Construction's quarterly Building Cost Index (https://bit.ly/2xWrf61), which the GC giant released on July 16. That Index, at 1149, was up 1.23% over the first quarter, and 5.51% over the second quarter of 2018. “Contractors continue to be selective due to the availability of skilled labor,” wrote Attilio Rivetti, Turner's vice president responsible for compiling its cost index.
To further make its case, RLB cites the Associated Builders and Contractors’ Construction Backlog Indicator, which reflects the amount of work that will be performed by commercial and industrial contractors in the months ahead. The backlog for 2018 averaged 9.15 months, slightly below the 2017 average but still up 17% from 2011.
The report breaks down current building costs by market and by seven typologies: offices, retail, hotels, hospitals, warehouses, parking, and residential. For example, Las Vegas, Phoenix, Portland, Seattle, and Denver continue to be relative bargains for office construction, based on their costs per sf. Los Angeles, Washington DC, and New York are the high-priced spreads when building hospitals. As for hotel construction, Honolulu and San Francisco are priciest.
Overall, Chicago experienced the greatest increase in construction bid costs (including materials, labor, and fees), 8.77%, between April 2018 and April 2019, followed San Francisco (7.05%), Portland (6.82%), Seattle (6.68%), Phoenix (6.47%), and Honolulu (5.83%), all above the national average increase.
Los Angeles, while no slouch on the construction front, was the only metro that RLB tracks that experienced a decrease in construction costs in the second quarter, down 1.22%.

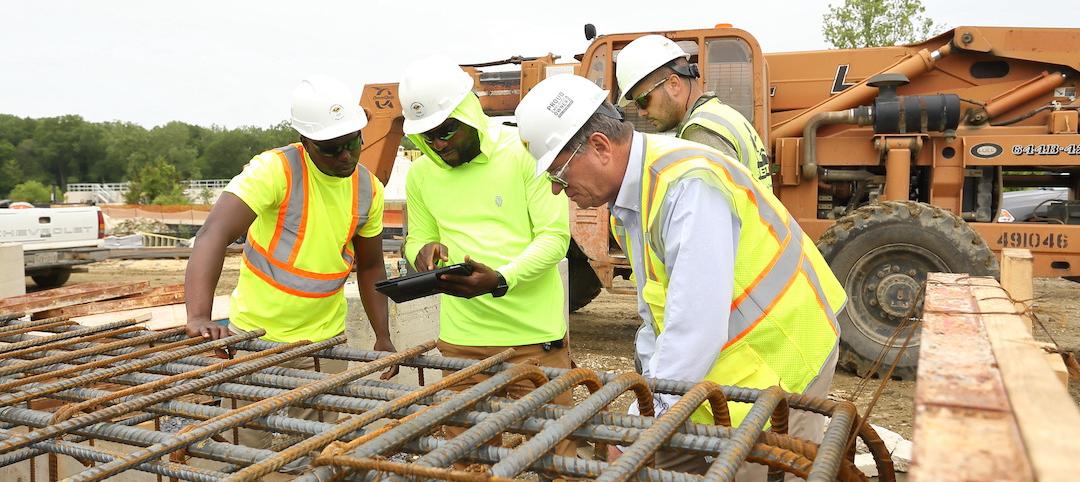
Chicago experienced the highest percentage increase in quarterly construction costs. Image: Rider Levett Bucknall
Through the first quarter of 2019, construction unemployment remained steady at 5.2%. The vast majority of construction firms are still having trouble filling open positions. And this situation could worsen, according to the Associated General Contractors of America, as a result of the Trump Administration’s proposal, announced last month, which would exclude the construction sector from the Labor Department’s apprenticeship framework. (Currently, more than three quarters of the federally administered apprenticeships in the U.S. are either in construction or part of military training, notes RLB.)
In a separate report that gauges construction activity by the number of cranes in use in North America, RLB’s July survey marked the fourth consecutive increase. However, only two of 11 U.S. markets tracked—Los Angeles and Denver—saw an increase in cranes. Five other cities were steady.
Cranes for commercial projects were up nationally and accounted for 41% of the cranes in use in New York City. In all markets, mixed-use and multifamily residential construction accounted for 67% of the cranes counted. In Seattle alone, mixed use and residential required 78% of cranes used.
Related Stories

Market Data | Nov 22, 2021
Only 16 states and D.C. added construction jobs since the pandemic began
Texas, Wyoming have worst job losses since February 2020, while Utah, South Dakota add the most.
Market Data | Nov 10, 2021
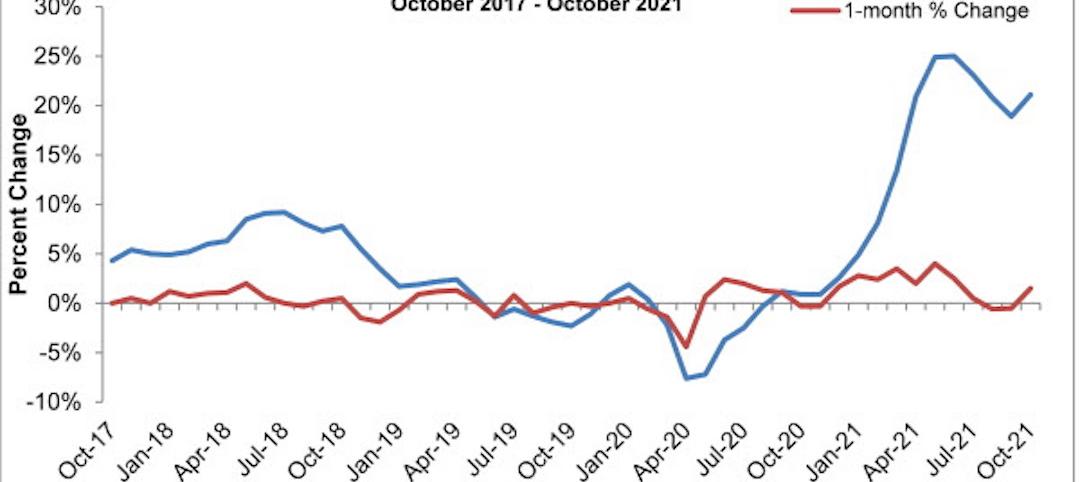
Construction input prices see largest monthly increase since June
Construction input prices are 21.1% higher than in October 2020.
Market Data | Nov 9, 2021
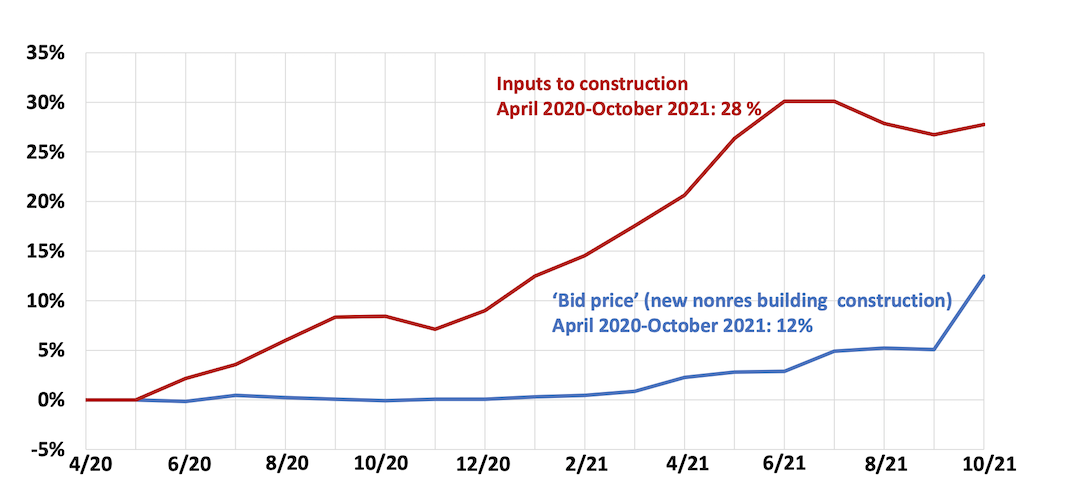
Continued increases in construction materials prices starting to drive up price of construction projects
Supply chain and labor woes continue.
Market Data | Nov 5, 2021
Construction firms add 44,000 jobs in October
Gain occurs even as firms struggle with supply chain challenges.
Market Data | Nov 3, 2021
One-fifth of metro areas lost construction jobs between September 2020 and 2021
Beaumont-Port Arthur, Texas and Sacramento--Roseville--Arden-Arcade Calif. top lists of gainers.
Market Data | Nov 2, 2021
Construction spending slumps in September
A drop in residential work projects adds to ongoing downturn in private and public nonresidential.

Hotel Facilities | Oct 28, 2021
Marriott leads with the largest U.S. hotel construction pipeline at Q3 2021 close
In the third quarter alone, Marriott opened 60 new hotels/7,882 rooms accounting for 30% of all new hotel rooms that opened in the U.S.

Hotel Facilities | Oct 28, 2021
At the end of Q3 2021, Dallas tops the U.S. hotel construction pipeline
The top 25 U.S. markets account for 33% of all pipeline projects and 37% of all rooms in the U.S. hotel construction pipeline.
Market Data | Oct 27, 2021
Only 14 states and D.C. added construction jobs since the pandemic began
Supply problems, lack of infrastructure bill undermine recovery.

Market Data | Oct 26, 2021
U.S. construction pipeline experiences highs and lows in the third quarter
Renovation and conversion pipeline activity remains steady at the end of Q3 ‘21, with conversion projects hitting a cyclical peak, and ending the quarter at 752 projects/79,024 rooms.


