For the twentieth consecutive month architecture firms reported increasing demand for design services in September, according to a new report today from The American Institute of Architects (AIA).
The AIA Architecture Billings Index (ABI) score for September was 51.7 down from a score of 53.3 in August, indicating essentially stable business conditions for architecture firms (any score above 50 indicates an increase in billings from the prior month). Also in September, both the new project inquiries and design contracts indexes moderated from August but remained positive with scores of 53.6 and 50.7, respectively.
“While billings in the Northeast region and the Institutional sector reached their highest pace of growth in several years, there appears to be emerging weakness in the previously healthy multifamily residential and commercial/industrial sectors, both of which saw a decline in billings for the first time since the post-pandemic recovery began,” said AIA Chief Economist, Kermit Baker, Hon. AIA, PhD. “Across the broader architecture sector, backlogs at firms remained at a robust 7.0 months as of the end of September, still near record-high levels since we began collecting this data regularly more than a decade ago.”
Key ABI highlights for September include:
- Regional averages: Northeast (54.6); Midwest (52.1); South (51.7); West (51.6)
- Sector index breakdown: institutional (58.9); mixed practice (50.3); commercial/industrial (49.6); multi-family residential (47.9)
The regional and sector categories are calculated as a three-month moving average, whereas the national index, design contracts and inquiries are monthly numbers.
Visit AIA’s website for more ABI information.
Related Stories
Higher Education | Feb 9, 2024
Disability and architecture: ADA and universal design at college campuses
To help people with disabilities feel part of the campus community, higher education institutions and architects must strive to create settings that not only adhere to but also exceed ADA guidelines.
Codes | Feb 9, 2024
Illinois releases stretch energy code for building construction
Illinois is the latest jurisdiction to release a stretch energy code that provides standards for communities to mandate more efficient building construction. St. Louis, Mo., and a few states, including California, Colorado, and Massachusetts, currently have stretch codes in place.
Giants 400 | Feb 8, 2024
Top 50 Public Library Architecture Firms for 2023
Quinn Evans, McMillan Pazdan Smith, PGAL, Skidmore, Owings & Merrill, and Gensler top BD+C's ranking of the nation's largest public library architecture and architecture/engineering (AE) firms for 2023, as reported in Building Design+Construction's 2023 Giants 400 Report.
Giants 400 | Feb 8, 2024
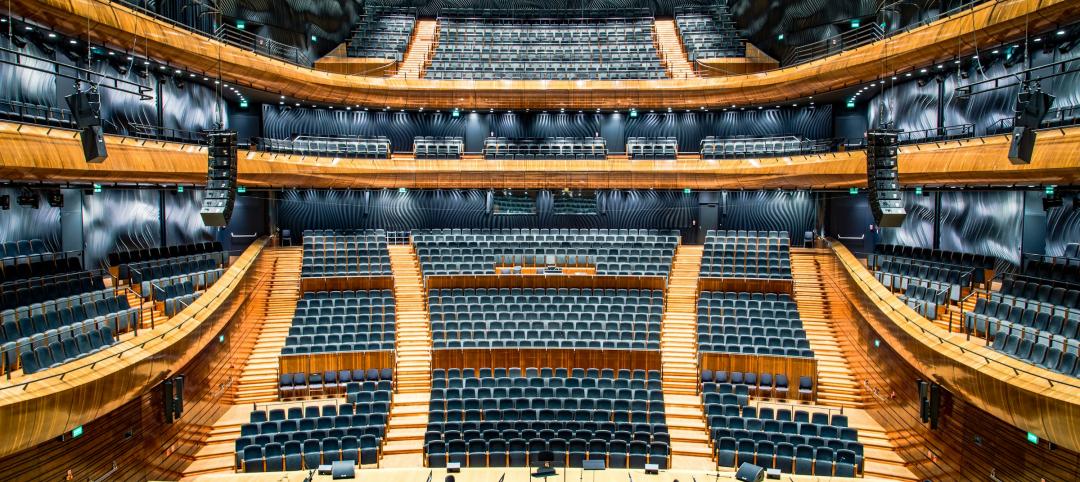
Top 60 Performing Arts Center and Concert Venue Architecture Firms for 2023
Populous, DLR Group, Gensler, HGA, and Perkins Eastman top BD+C's ranking of the nation's largest performing arts center and concert venue architecture and architecture/engineering (AE) firms for 2023, as reported in Building Design+Construction's 2023 Giants 400 Report.
Giants 400 | Feb 8, 2024
Top 70 Museum Architecture Firms for 2023
SmithGroup, Gensler, Ayers Saint Gross, Quinn Evans, HGA, and Cooper Robertson head BD+C's ranking of the nation's largest museum and gallery architecture and architecture/engineering (AE) firms for 2023, as reported in Building Design+Construction's 2023 Giants 400 Report.
Market Data | Feb 7, 2024
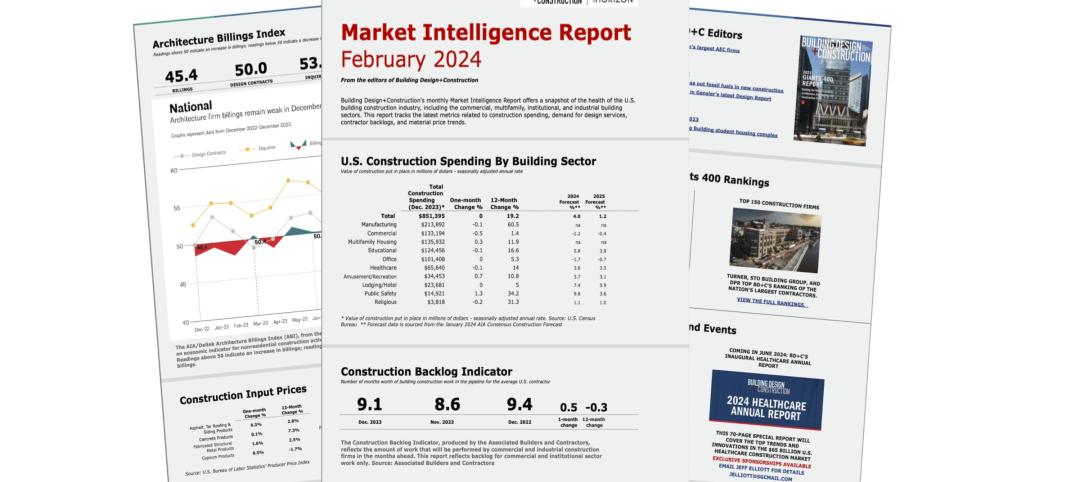
New download: BD+C's February 2024 Market Intelligence Report
Building Design+Construction's monthly Market Intelligence Report offers a snapshot of the health of the U.S. building construction industry, including the commercial, multifamily, institutional, and industrial building sectors. This report tracks the latest metrics related to construction spending, demand for design services, contractor backlogs, and material price trends.
Giants 400 | Feb 6, 2024
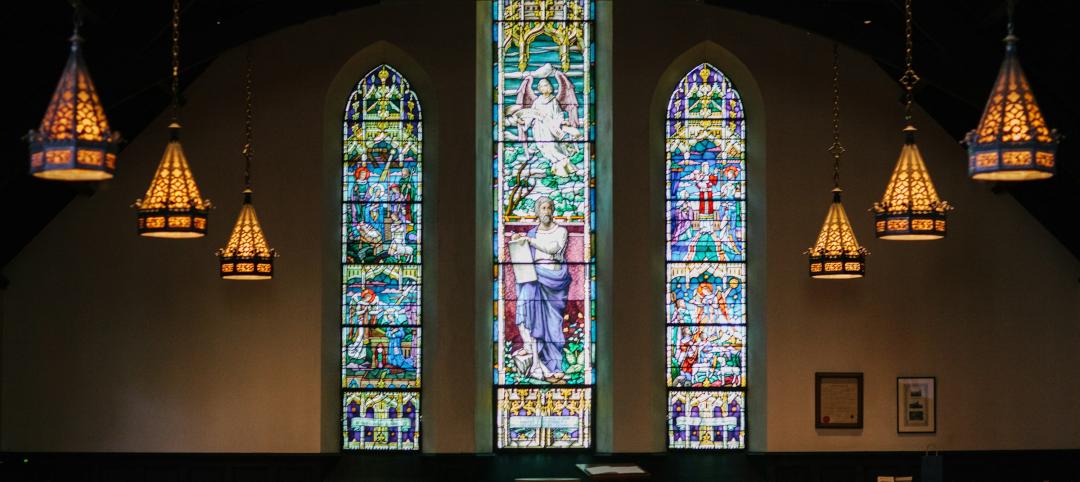
Top 80 Religious Facility Architecture Firms for 2023
Parkhill, FGM Architects, GFF, Gensler, and HOK top BD+C's ranking of the nation's largest religious facility architecture and architecture engineering (AE) firms for 2023, as reported in the 2023 Giants 400 Report.
Modular Building | Feb 6, 2024
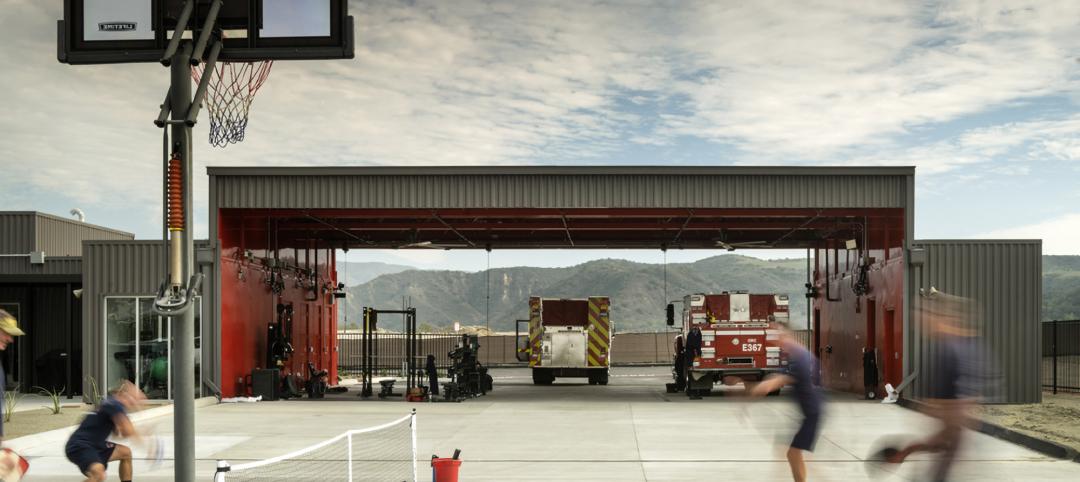
Modular fire station allows for possible future reconfigurations
A fire station in Southern California leveraged prefab, modular construction for faster completion and future reconfiguration.
Giants 400 | Feb 5, 2024
Top 30 Entertainment Center, Cineplex, and Theme Park Architecture Firms for 2023
Gensler, JLL, Nelson Worldwide, AO, and Stantec top BD+C's ranking of the nation's largest entertainment center, cineplex, and theme park architecture and architecture engineering (AE) firms for 2023, as reported in the 2023 Giants 400 Report.
Giants 400 | Feb 5, 2024
Top 90 Shopping Mall, Big Box Store, and Strip Center Architecture Firms for 2023
Gensler, Arcadis North America, Core States Group, WD Partners, and MBH Architects top BD+C's ranking of the nation's largest shopping mall, big box store, and strip center architecture and architecture engineering (AE) firms for 2023, as reported in the 2023 Giants 400 Report.


