

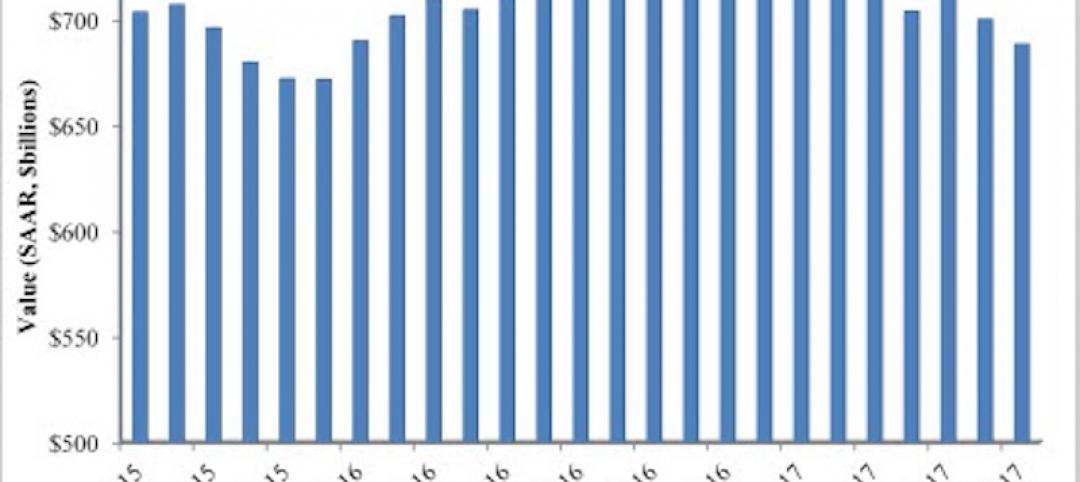
There were a few occasions where demand for design services decreased from a month-to-month basis in 2015, but the Architecture Billings Index (ABI) concluded the year in positive terrain and was so in eight of the 12 months of the year.
The American Institute of Architects (AIA) reported the December ABI score was 50.9, up from the mark of 49.3 in the previous month. This score reflects a slight increase in design services (any score above 50 indicates an increase in billings). The new projects inquiry index was 60.2, up from a reading of 58.6 the previous month.
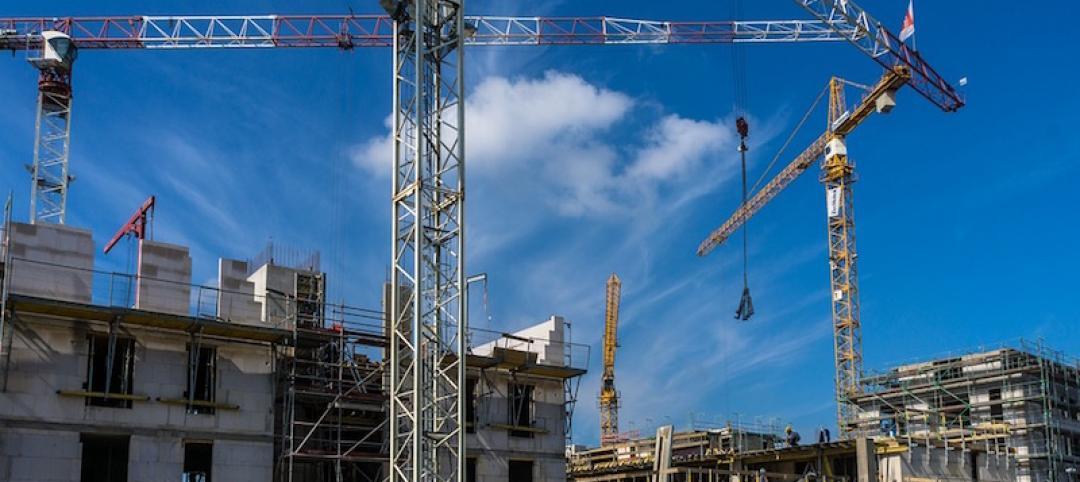
As a leading economic indicator of construction activity, the ABI reflects the approximate nine to twelve month lead time between architecture billings and construction spending.
“As has been the case for the past several years, there continues to be a mix of business conditions that architecture firms are experiencing,” said AIA Chief Economist Kermit Baker, Hon. AIA, PhD. “Overall, however, ABI scores for 2015 averaged just below the strong showing in 2014, which points to another healthy year for construction this year.”
Key December ABI highlights:
- Regional averages: West (53.7), South (53.3), Northeast (46.7), Midwest (46.1),
- Sector index breakdown: multi-family residential (52.9), institutional (52.2), commercial / industrial (47.3), mixed practice (46.5)
- Project inquiries index: 60.2
- Design contracts index: 51.0
The regional and sector categories are calculated as a 3-month moving average, whereas the national index, design contracts and inquiries are monthly numbers.
Related Stories
Market Data | Oct 19, 2017
Architecture Billings Index backslides slightly
Business conditions easing in the West.

Industry Research | Oct 3, 2017
Nonresidential construction spending stabilizes in August
Spending on nonresidential construction services is still down on a YOY basis.

Market Data | Sep 21, 2017
Architecture Billings Index continues growth streak
Design services remain in high demand across all regions and in all major sectors.

Market Data | Sep 21, 2017
How brand research delivers competitive advantage
Brand research is a process that firms can use to measure their reputation and visibility in the marketplace.

Contractors | Sep 19, 2017
Commercial Construction Index finds high optimism in U.S. commercial construction industry
Hurricane recovery efforts expected to heighten concerns about labor scarcities in the south, where two-thirds of contractors already face worker shortages.

Multifamily Housing | Sep 15, 2017
Hurricane Harvey damaged fewer apartments in greater Houston than estimated
As of Sept. 14, 166 properties reported damage to 8,956 units, about 1.4% of the total supply of apartments, according to ApartmentData.com.
Hotel Facilities | Sep 6, 2017
Marriott has the largest construction pipeline of any franchise company in the U.S.
Marriott has the most rooms currently under construction with 482 Projects/67,434 Rooms.
Market Data | Sep 5, 2017
Nonresidential construction declines again, public and private sector down in July
Weakness in spending was widespread.

Market Data | Aug 29, 2017
Hidden opportunities emerge from construction industry challenges
JLL’s latest construction report shows stability ahead with tech and innovation leading the way.

Market Data | Aug 28, 2017
U.S. hotel construction pipeline is up 7% year-over-year
For the economy, the rate of growth may be low but it’s running on all cylinders.


