


A slight improvement in business conditions has led to fewer architecture firms reporting declining billings, according to a new report today from The American Institute of Architects (AIA).
AIA’s Architecture Billings Index (ABI) score for January was 44.9* compared to 42.3 in December (any score below 50 indicates a decline in firm billings). Last month’s score indicates overall revenue at U.S architecture firms continued to decline from December to January, however, the pace of decline slowed. Inquiries into new projects during January grew for the second month in a row, with a score of 56.8 compared to 51.7 in December. The value of new design contracts also reflected an easing in the pace of decline, rising to a score of 48.8 in January from 47.0 the previous month.
“The broader economy entered a soft spot during the fourth quarter of last year, and business conditions at design firms have reflected this general slowdown,” said AIA Chief Economist, Kermit Baker, Hon. AIA, PhD. “While federal stimulus and the increasing pace of vaccinations may begin to accelerate progress in the coming months, the year has gotten off to a slow start, with architecture firms in all regions of the country and in all specializations reporting continued declines in project billings.”
Key ABI highlights for January include:
- Regional averages: South (47.4); West (42.8); Midwest (42.2); Northeast (41.9)
- Sector index breakdown: mixed practice (47.9); multi-family residential (44.4); commercial/industrial (44.3); institutional (39.9)
- Project inquiries index: 56.8
- Design contracts index: 48.8
The regional and sector categories are calculated as a three-month moving average, whereas the national index, design contracts and inquiries are monthly numbers.
To learn more about recent economic developments impacting design and construction, visit AIA’s website.
*Every January the AIA research department updates the seasonal factors used to calculate the ABI, resulting in a revision of recent ABI values.
Related Stories
Market Data | Nov 2, 2018
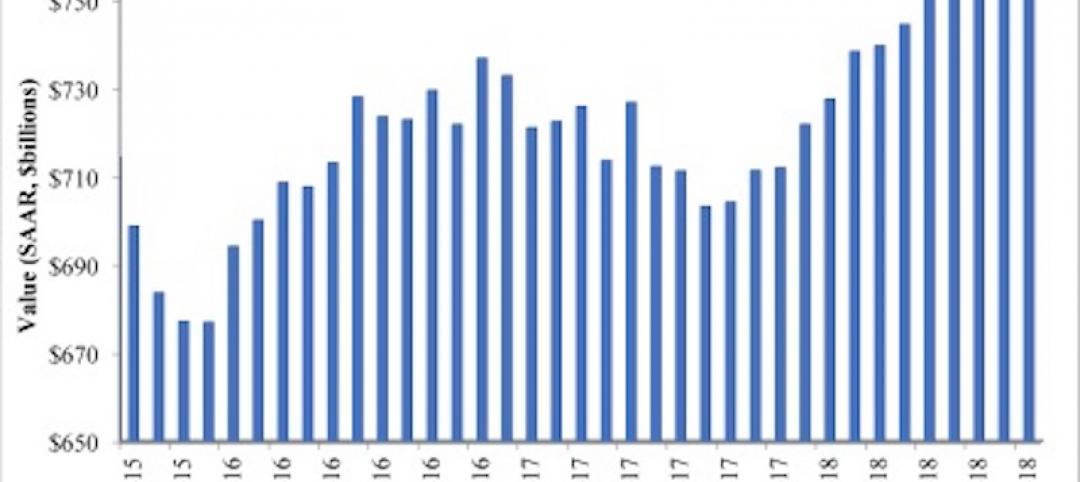
Nonresidential spending retains momentum in September, up 8.9% year over year
Total nonresidential spending stood at $767.1 billion on a seasonally adjusted, annualized rate in September.

Market Data | Oct 30, 2018
Construction projects planned and ongoing by world’s megacities valued at $4.2trn
The report states that Dubai tops the list with total project values amounting to US$374.2bn.
Market Data | Oct 26, 2018
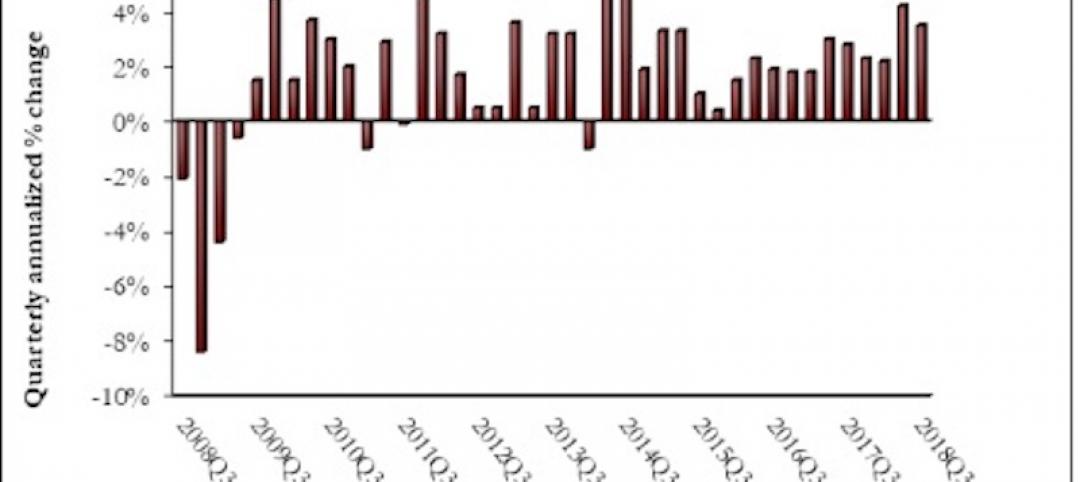
Nonresidential fixed investment returns to earth in Q3
Despite the broader economic growth, fixed investment inched 0.3% lower in the third quarter.
Market Data | Oct 24, 2018
Architecture firm billings slow but remain positive in September
Billings growth slows but is stable across sectors.

Market Data | Oct 19, 2018
New York’s five-year construction spending boom could be slowing over the next two years
Nonresidential building could still add more than 90 million sf through 2020.

Market Data | Oct 8, 2018
Global construction set to rise to US$12.9 trillion by 2022, driven by Asia Pacific, Africa and the Middle East
The pace of global construction growth is set to improve slightly to 3.7% between 2019 and 2020.

Market Data | Sep 25, 2018
Contractors remain upbeat in Q2, according to ABC’s latest Construction Confidence Index
More than three in four construction firms expect that sales will continue to rise over the next six months, while three in five expect higher profit margins.

Market Data | Sep 24, 2018
Hotel construction pipeline reaches record highs
There are 5,988 projects/1,133,017 rooms currently under construction worldwide.
Market Data | Sep 21, 2018
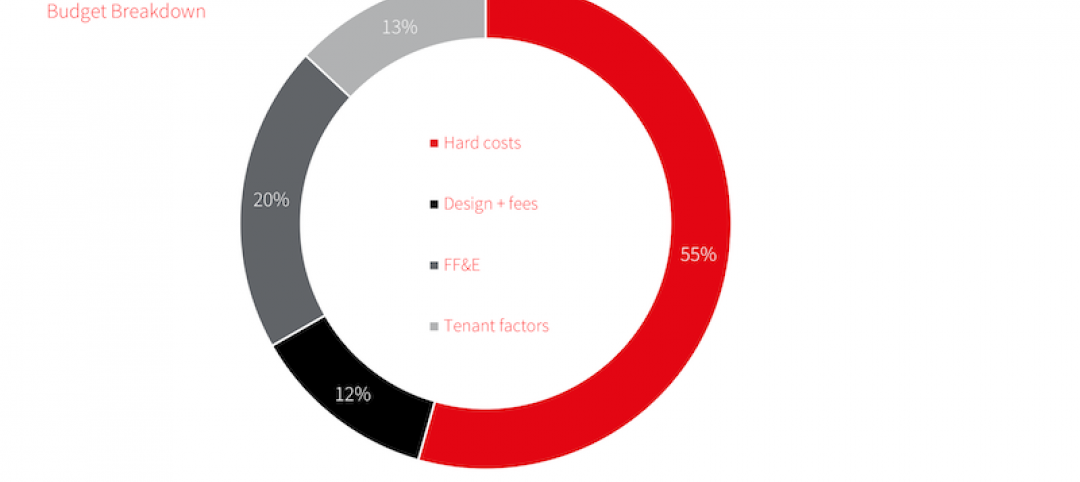
JLL fit out report portrays a hot but tenant-favorable office market
This year’s analysis draws from 2,800 projects.
Market Data | Sep 21, 2018
Mid-year forecast: No end in sight for growth cycle
The AIA Consensus Construction Forecast is projecting 4.7% growth in nonresidential construction spending in 2018.


