


A slight improvement in business conditions has led to fewer architecture firms reporting declining billings, according to a new report today from The American Institute of Architects (AIA).
AIA’s Architecture Billings Index (ABI) score for January was 44.9* compared to 42.3 in December (any score below 50 indicates a decline in firm billings). Last month’s score indicates overall revenue at U.S architecture firms continued to decline from December to January, however, the pace of decline slowed. Inquiries into new projects during January grew for the second month in a row, with a score of 56.8 compared to 51.7 in December. The value of new design contracts also reflected an easing in the pace of decline, rising to a score of 48.8 in January from 47.0 the previous month.
“The broader economy entered a soft spot during the fourth quarter of last year, and business conditions at design firms have reflected this general slowdown,” said AIA Chief Economist, Kermit Baker, Hon. AIA, PhD. “While federal stimulus and the increasing pace of vaccinations may begin to accelerate progress in the coming months, the year has gotten off to a slow start, with architecture firms in all regions of the country and in all specializations reporting continued declines in project billings.”
Key ABI highlights for January include:
- Regional averages: South (47.4); West (42.8); Midwest (42.2); Northeast (41.9)
- Sector index breakdown: mixed practice (47.9); multi-family residential (44.4); commercial/industrial (44.3); institutional (39.9)
- Project inquiries index: 56.8
- Design contracts index: 48.8
The regional and sector categories are calculated as a three-month moving average, whereas the national index, design contracts and inquiries are monthly numbers.
To learn more about recent economic developments impacting design and construction, visit AIA’s website.
*Every January the AIA research department updates the seasonal factors used to calculate the ABI, resulting in a revision of recent ABI values.
Related Stories

Market Data | Sep 10, 2019
Apartment buildings and their residents contribute $3.4 trillion to the national economy
New data show how different aspects of the apartment industry positively impact national, state and local economies.

Market Data | Sep 3, 2019
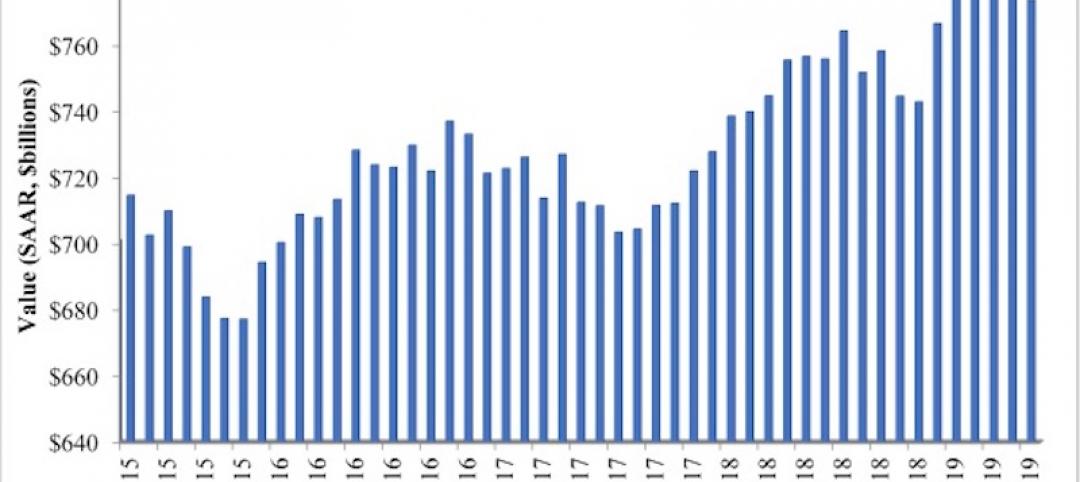
Nonresidential construction spending slips in July 2019, but still surpasses $776 billion
Construction spending declined 0.3% in July, totaling $776 billion on a seasonally adjusted annualized basis.
Industry Research | Aug 29, 2019
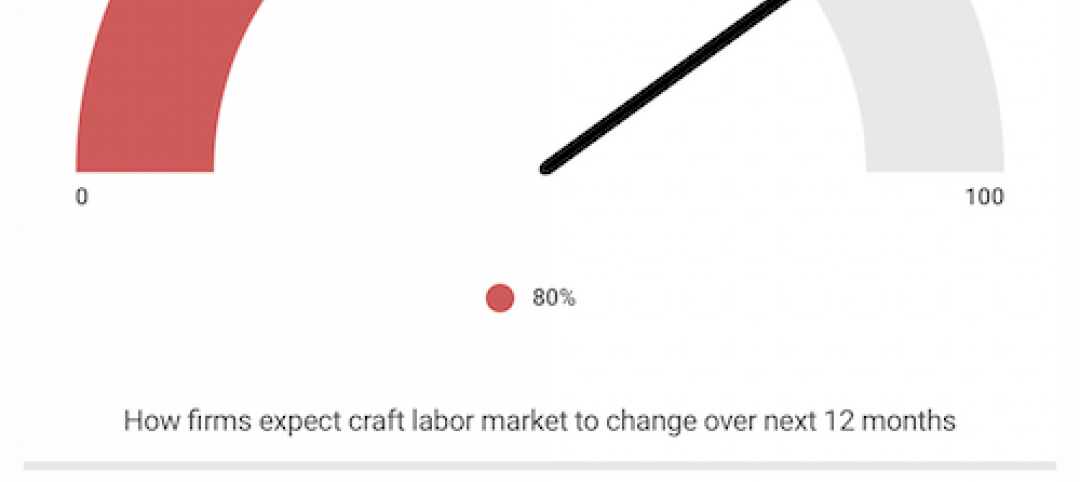
Construction firms expect labor shortages to worsen over the next year
A new AGC-Autodesk survey finds more companies turning to technology to support their jobsites.
Market Data | Aug 21, 2019
Architecture Billings Index continues its streak of soft readings
Decline in new design contracts suggests volatility in design activity to persist.
Market Data | Aug 19, 2019
Multifamily market sustains positive cycle
Year-over-year growth tops 3% for 13th month. Will the economy stifle momentum?

Market Data | Aug 16, 2019
Students say unclean restrooms impact their perception of the school
The findings are part of Bradley Corporation’s Healthy Hand Washing Survey.

Market Data | Aug 12, 2019
Mid-year economic outlook for nonresidential construction: Expansion continues, but vulnerabilities pile up
Emerging weakness in business investment has been hinting at softening outlays.
Market Data | Aug 7, 2019
National office vacancy holds steady at 9.7% in slowing but disciplined market
Average asking rental rate posts 4.2% annual growth.
Market Data | Aug 1, 2019
Nonresidential construction spending slows in June, remains elevated
Among the 16 nonresidential construction spending categories tracked by the Census Bureau, seven experienced increases in monthly spending.

Market Data | Jul 31, 2019
For the second quarter of 2019, the U.S. hotel construction pipeline continued its year-over-year growth spurt
The growth spurt continued even as business investment declined for the first time since 2016.


