


The Architecture Billings Index (ABI), produced by the AIA Economics & Market Research Group, is a leading economic indicator that provides an approximately nine- to twelve-month glimpse into the future of nonresidential construction spending activity. The diffusion indexes contained in the full report are derived from a monthly “work-on-the-boards” survey that is sent to a panel of AIA member-owned firms.
Participants are asked whether their billings increased, decreased, or stayed the same in the month that just ended as compared to the prior month, and the results are then compiled into the ABI. These monthly results are also seasonally adjusted to allow for comparison to prior months. The monthly ABI index scores are centered around 50, with scores above 50 indicating an aggregate increase in billings, and scores below 50 indicating a decline.
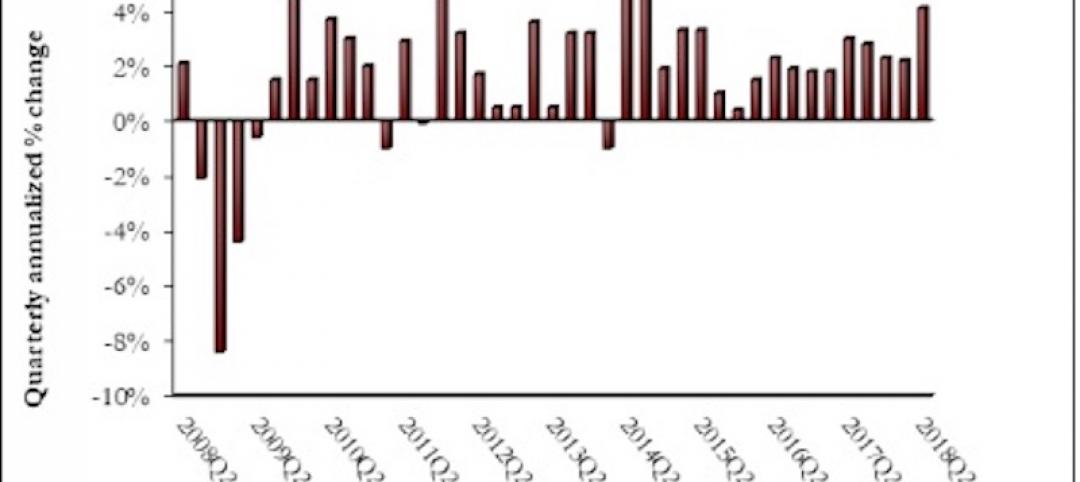
Following a generally positive performance in 2015, the Architecture Billings Index has begun this year modestly dipping back into negative terrain. The AIA reported the January ABI score was 49.6, down slightly from the mark of 51.3 in the previous month. This score reflects a minor decrease in design services (any score above 50 indicates an increase in billings). The new projects inquiry index was 55.3, down from a reading of 60.5 the previous month.
“The fundamentals are mostly sound in the nonresidential design and construction market,” said AIA Chief Economist, Kermit Baker, Hon. AIA, PhD. “January was a rocky month throughout the economy, with falling oil prices, international economic concerns, and with steep declines in stock market valuations in the U.S. and elsewhere. Some of the fallout of this uncertainty may have affected progress on design projects.”
Key January* ABI highlights:
- Regional averages: West (50.8), Northeast (50.4), South (50.3), Midwest (48.9),
- Sector index breakdown: multifamily residential (51.9), commercial / industrial (50.5), institutional (49.9), mixed practice (49.0)
- Project inquiries index: 55.3
- Design contracts index: 50.9
The regional and sector categories are calculated as a 3-month moving average, whereas the national index, design contracts and inquiries are monthly numbers.
* Every January the AIA research department updates the seasonal factors used to calculate the ABI, resulting in a revision of recent ABI values.
Related Stories

Market Data | Aug 9, 2018
Projections reveal nonresidential construction spending to grow
AIA releases latest Consensus Construction Forecast.
Market Data | Aug 7, 2018
New supply's impact illustrated in Yardi Matrix national self storage report for July
The metro with the most units under construction and planned as a percent of existing inventory in mid-July was Nashville, Tenn.
Market Data | Aug 3, 2018
U.S. multifamily rents reach new heights in July
Favorable economic conditions produce a sunny summer for the apartment sector.
Market Data | Aug 2, 2018
Nonresidential construction spending dips in June
“The hope is that June’s construction spending setback is merely a statistical aberration,” said ABC Chief Economist Anirban Basu.

Market Data | Aug 1, 2018
U.S. hotel construction pipeline continues moderate growth year-over-year
The hotel construction pipeline has been growing moderately and incrementally each quarter.
Market Data | Jul 30, 2018
Nonresidential fixed investment surges in second quarter
Nonresidential fixed investment represented an especially important element of second quarter strength in the advance estimate.

Market Data | Jul 11, 2018
Construction material prices increase steadily in June
June represents the latest month associated with rapidly rising construction input prices.

Market Data | Jun 26, 2018
Yardi Matrix examines potential regional multifamily supply overload
Outsize development activity in some major metros could increase vacancy rates and stagnate rent growth.

Market Data | Jun 22, 2018
Multifamily market remains healthy – Can it be sustained?
New report says strong economic fundamentals outweigh headwinds.
Market Data | Jun 21, 2018
Architecture firm billings strengthen in May
Architecture Billings Index enters eighth straight month of solid growth.


