


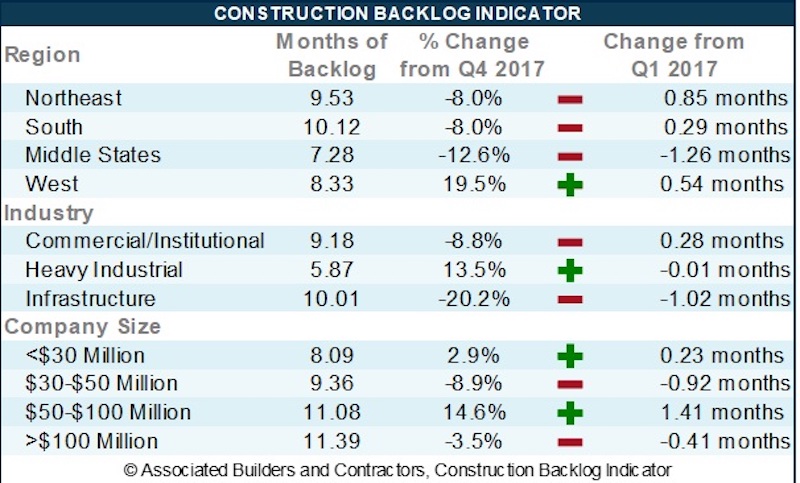
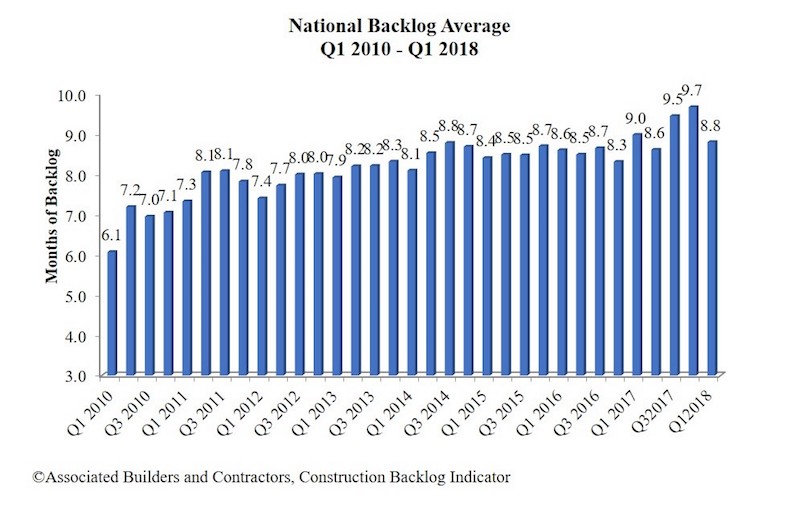
Associated Builders and Contractors (ABC) reports that its Construction Backlog Indicator (CBI) contracted to 8.8 months during the first quarter of 2018, down 9% from the prior quarter. CBI is down 2% on a year-over-year basis.
“The Construction Backlog Indicator hit an all-time high during the fourth quarter of 2017,” said ABC Chief Economist Anirban Basu. “A number of factors pushed backlog lower during the first quarter of 2018, including an extensive winter. Only one region has experienced a decline in backlog on a year-over-year basis: the Middle States, which encompasses the Upper Midwest. There also was a significant uptick in survey participation during the first quarter, which may have helped shape the result. In sum, average backlog remains lofty by historic standards.
“Given improved weather and normal seasonal factors, it is likely that backlog will bounce back during the second quarter. However, the level of improvement may be undermined by a combination of worker shortages and rapidly rising construction materials prices. Despite recent increases in the costs of delivering construction services due to rising human capital and materials costs, there is scant evidence of a decline in demand for construction services,” said Basu.
Highlights by Region
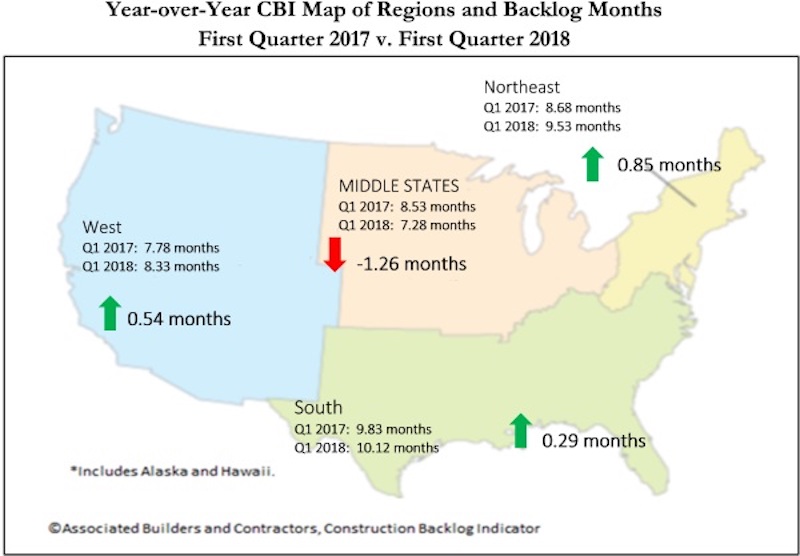
— Backlog in the South fell 8% during the first quarter, but remains 2.9% higher on a year-over-year basis. Large metropolitan areas such as Tampa, Fla., Atlanta, Dallas and Austin, Texas, continue to generate significant construction activity. Expect backlog to remain lengthy as communities impacted by last year’s storms continue to rebuild.
— Backlog in the Northeast fell after expanding for five consecutive quarters. Large cities along the northeast corridor continue to attract commercial investment, including the suburbs of Baltimore. Despite the first quarter decline in backlog, the region’s reading remains elevated by historical standards.
— Backlog in the Middle States is down 12.6% for the quarter (more than a full month) and 14.7% year over year. Weather played a role, but other factors are at work. Tariffs and threats of trade wars impact this region disproportionately given its central role in the nation’s industrial production.
— Backlog in the West surged to its highest level since mid-2014. Rebuilding from prior wildfires likely played a role, but the bigger reason relates to surging technology sectors in San Jose, Calif., San Francisco, Seattle, Portland, Ore., Los Angeles and San Diego.
Highlights by Industry
— Backlog in the commercial/institutional segment fell for the first time since the end of 2016. Despite the 8.8% quarterly decline, backlog in this segment remains 3.2% higher than the same time one year ago. However, this sector is vulnerable to further declines given its significant exposure to rising borrowing costs, higher materials prices and growing concerns regarding product saturation in a number of first-tier American real estate markets.
— Average backlog in the heavy industrial category rebounded during the first quarter, expanding 13.5%. Despite this sizable increase, the segment remains roughly unchanged at historically low levels on a year-over-year basis. Construction spending related to manufacturing has been drifting lower for months. While there have been some highly visible announcements regarding large capital projects in this segment, concerns regarding trade wars are likely to suppress backlog to a meaningful degree.
— Backlog in the infrastructure category drifted back to Earth during the first quarter, declining by more than two months from levels observed during the fourth quarter of 2017. This reading may have been impacted by a sharp increase in survey participation. Weather likely played an even larger role. The expectation is that backlog in this category will expand for the balance of the year as improving state and local government finances spur more investment in education, public safety, highway/street and other publicly financed categories.
Highlights by Company Size
— Large firms—those with annual revenues in excess of $100 million—experienced a sharp decline in backlog. This overlapped neatly with the decline in backlog related to infrastructure. Backlog for these large firms remains higher than any other classification considered in this release.
— Backlog among firms with annual revenues between $50 million and $100 million increased 0.4 months during the first quarter and currently stands at its second highest level since the series began in 2008. This group is heavily impacted by certain construction segments that have experienced little interruption in construction spending momentum.
— Firms with between $30 million and $50 million in annual revenues experienced a sharp decline in first quarter backlog. Enhanced survey participation likely explains part of this result. This group is significantly exposed to the energy sector, which stands to see an uptick in activity given recent trends in oil prices.
— Backlog for firms with annual revenues of less than $30 million increased 0.3 months during the first quarter and remains remarkable steady. This stability is likely the product of a dearth of available subcontractors to do electrical, mechanical, glass installation and other forms of work.
CBI is a leading economic indicator that reflects the amount of construction work under contract, but not yet completed. CBI is measured in months, with a lengthening backlog implying expanding demand for construction services. More CBI charts and graphs are available on abc.org.
Related Stories

Market Data | Nov 27, 2023
Number of employees returning to the office varies significantly by city
While the return-to-the-office trend is felt across the country, the percentage of employees moving back to their offices varies significantly according to geography, according to Eptura’s Q3 Workplace Index.

Market Data | Nov 14, 2023
The average U.S. contractor has 8.4 months worth of construction work in the pipeline, as of September 2023
Associated Builders and Contractors reported that its Construction Backlog Indicator declined to 8.4 months in October from 9.0 months in September, according to an ABC member survey conducted from Oct. 19 to Nov. 2. The reading is down 0.4 months from October 2022. Backlog now stands at its lowest level since the first quarter of 2022.

Multifamily Housing | Nov 9, 2023
Multifamily project completions forecast to slow starting 2026
Yardi Matrix has released its Q4 2023 Multifamily Supply Forecast, emphasizing a short-term spike and plateau of new construction.

Contractors | Nov 1, 2023
Nonresidential construction spending increases for the 16th straight month, in September 2023
National nonresidential construction spending increased 0.3% in September, according to an Associated Builders and Contractors analysis of data published today by the U.S. Census Bureau. On a seasonally adjusted annualized basis, nonresidential spending totaled $1.1 trillion.

Market Data | Oct 23, 2023
New data finds that the majority of renters are cost-burdened
The most recent data derived from the 2022 Census American Community Survey reveals that the proportion of American renters facing housing cost burdens has reached its highest point since 2012, undoing the progress made in the ten years leading up to the pandemic.

Contractors | Oct 19, 2023
Crane Index indicates slowing private-sector construction
Private-sector construction in major North American cities is slowing, according to the latest RLB Crane Index. The number of tower cranes in use declined 10% since the first quarter of 2023. The index, compiled by consulting firm Rider Levett Bucknall (RLB), found that only two of 14 cities—Boston and Toronto—saw increased crane counts.

Market Data | Oct 2, 2023
Nonresidential construction spending rises 0.4% in August 2023, led by manufacturing and public works sectors
National nonresidential construction spending increased 0.4% in August, according to an Associated Builders and Contractors analysis of data published today by the U.S. Census Bureau. On a seasonally adjusted annualized basis, nonresidential spending totaled $1.09 trillion.

Giants 400 | Sep 28, 2023
Top 100 University Building Construction Firms for 2023
Turner Construction, Whiting-Turner Contracting Co., STO Building Group, Suffolk Construction, and Skanska USA top BD+C's ranking of the nation's largest university sector contractors and construction management firms for 2023, as reported in Building Design+Construction's 2023 Giants 400 Report. Note: This ranking includes revenue for all university/college-related buildings except student residence halls, sports/recreation facilities, laboratories, S+T-related buildings, parking facilities, and performing arts centers (revenue for those buildings are reported in their respective Giants 400 ranking).

Construction Costs | Sep 28, 2023
U.S. construction market moves toward building material price stabilization
The newly released Quarterly Construction Cost Insights Report for Q3 2023 from Gordian reveals material costs remain high compared to prior years, but there is a move towards price stabilization for building and construction materials after years of significant fluctuations. In this report, top industry experts from Gordian, as well as from Gilbane, McCarthy Building Companies, and DPR Construction weigh in on the overall trends seen for construction material costs, and offer innovative solutions to navigate this terrain.

Data Centers | Sep 21, 2023
North American data center construction rises 25% to record high in first half of 2023, driven by growth of artificial intelligence
CBRE’s latest North American Data Center Trends Report found there is 2,287.6 megawatts (MW) of data center supply currently under construction in primary markets, reaching a new all-time high with more than 70% already preleased.


