


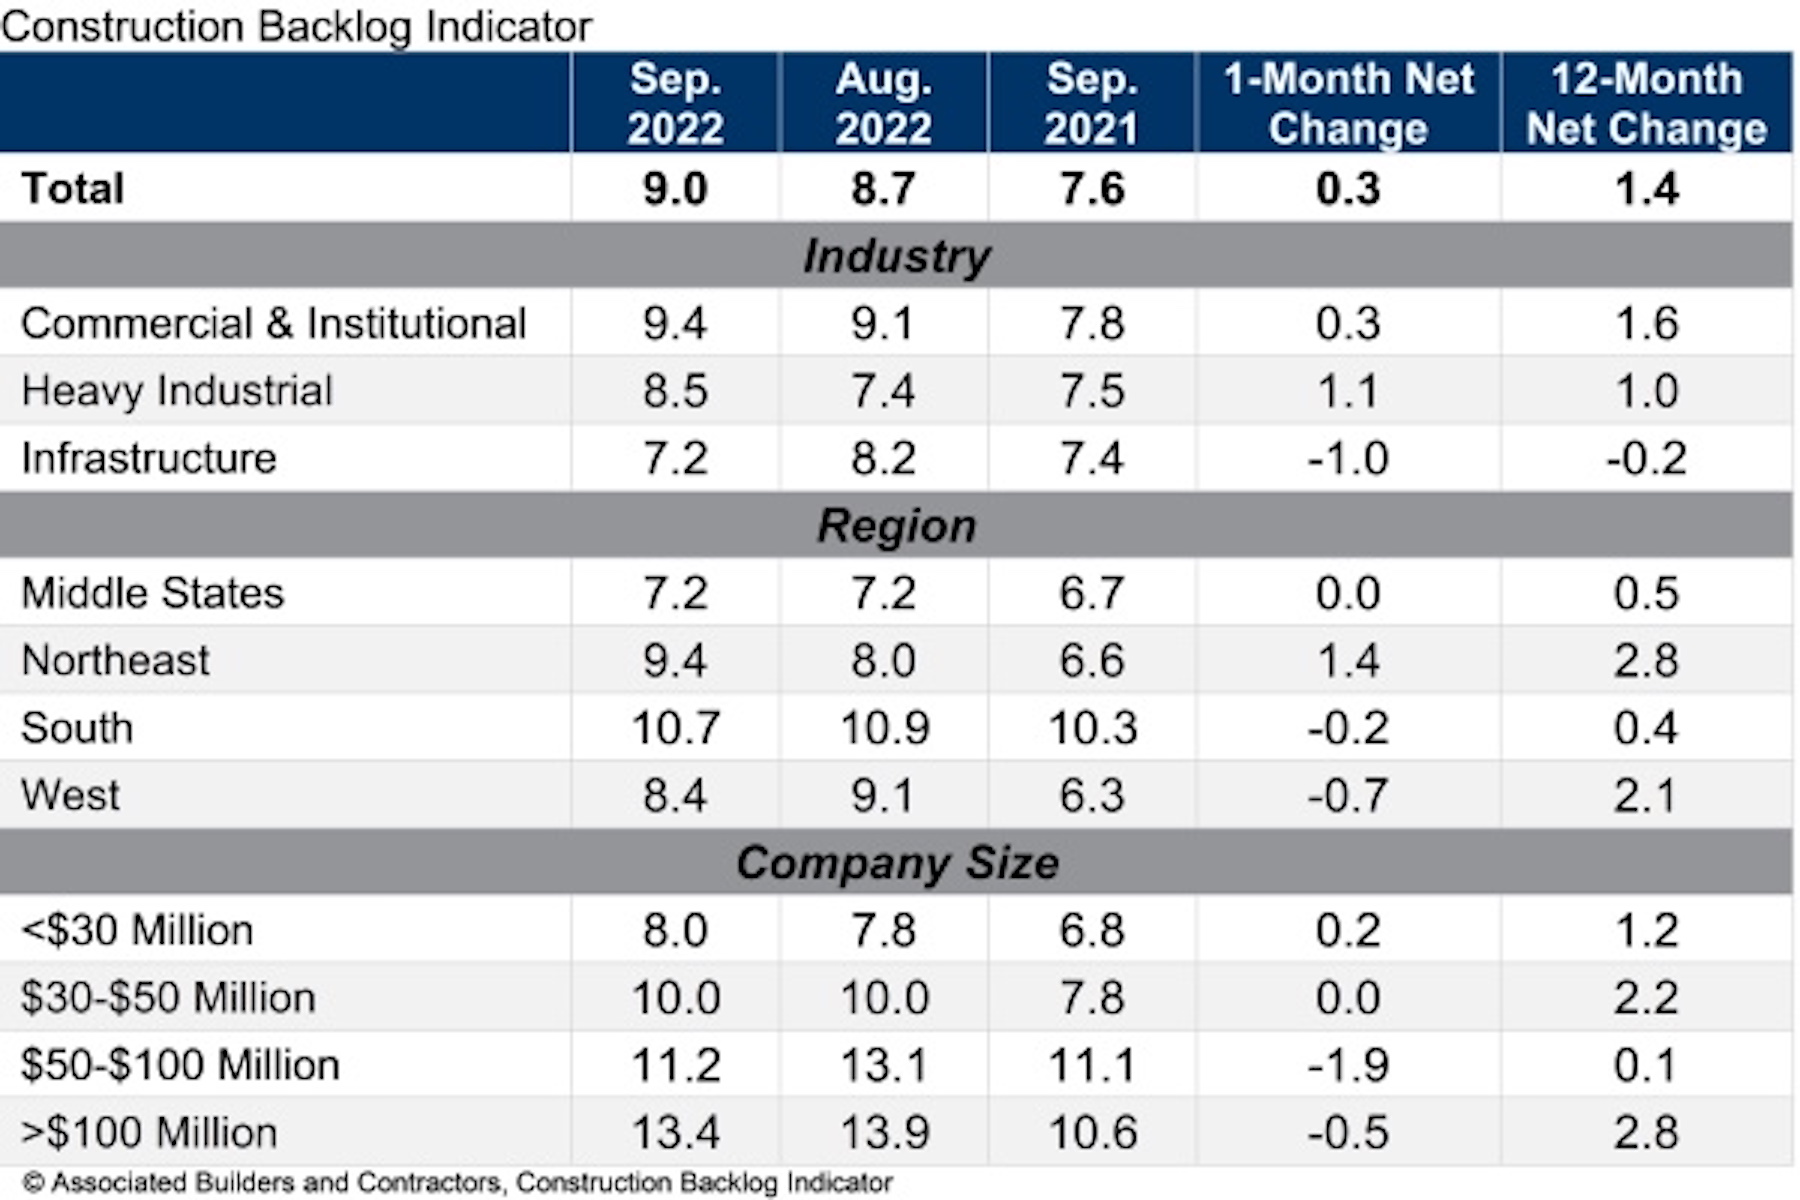
Associated Builders and Contractors reports today that its Construction Backlog Indicator increased to 9.0 months in September, according to an ABC member survey conducted Sept. 20 to Oct. 5. The reading is 1.4 months higher than in September 2021.
View ABC’s Construction Backlog Indicator and Construction Confidence Index tables for September 2022.
Backlog reached its highest level since May 2022 and is once again above the level observed at the start of the pandemic (8.9 months in February 2020). Backlog in heavy industrial increased sizably in September, spurred by a 21.5% year-over-year increase in manufacturing-related construction spending.
ABC’s Construction Confidence Index readings for profit margins and staffing levels increased in September, while the reading for sales moved slightly lower. All three readings remain above the threshold of 50, indicating expectations of growth over the next six months.
“The construction confidence and backlog metrics appear strong despite the U.S. economy facing headwinds like inflation, financial market volatility and rapidly rising borrowing costs,” said ABC Chief Economist Anirban Basu. “Contractors remain decidedly upbeat, with backlog expanding and expectations for rising sales, employment and profit margins over the next six months.
“One would think the recent surge in interest rates would be enough to dampen contractor confidence,” said Basu. “Instead, project owners continue to move forward with a significant number of projects. Faced with high demand for their services, contractors continue to show pricing power, helping to offset rising compensation and other construction delivery costs.”
Note: The reference months for the Construction Backlog Indicator and Construction Confidence Index data series were revised on May 12, 2020, to better reflect the survey period. CBI quantifies the previous month’s work under contract based on the latest financials available, while CCI measures contractors’ outlook for the next six months.
Related Stories

Market Data | Jun 22, 2018
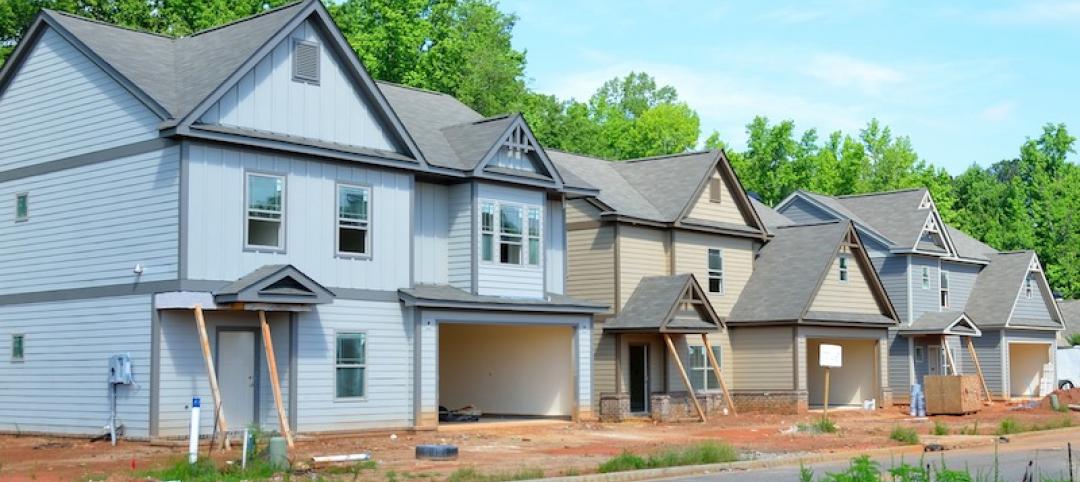
Multifamily market remains healthy – Can it be sustained?
New report says strong economic fundamentals outweigh headwinds.

Market Data | Jun 21, 2018
Architecture firm billings strengthen in May
Architecture Billings Index enters eighth straight month of solid growth.

Market Data | Jun 20, 2018
7% year-over-year growth in the global construction pipeline
There are 5,952 projects/1,115,288 rooms under construction, up 8% by projects YOY.
Market Data | Jun 19, 2018
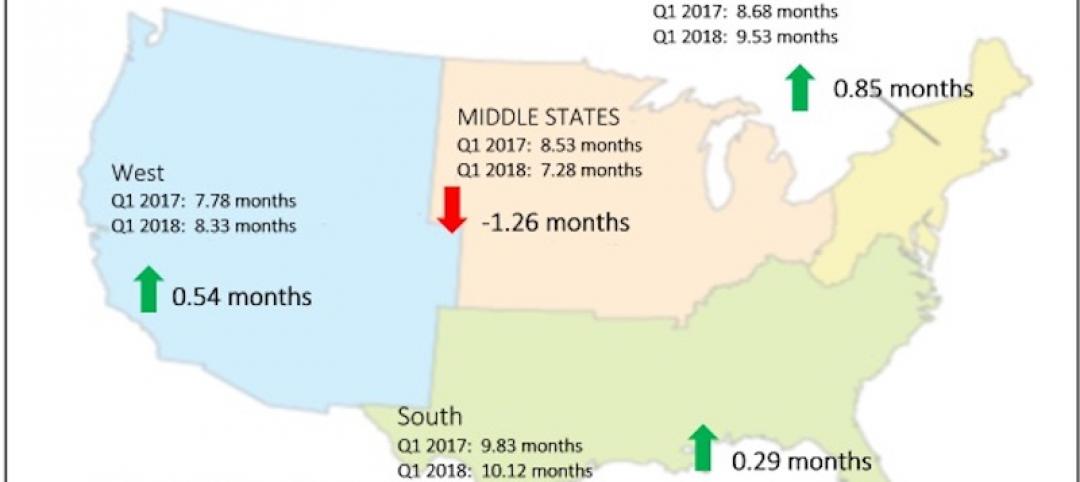
ABC’s Construction Backlog Indicator remains elevated in first quarter of 2018
The CBI shows highlights by region, industry, and company size.
Market Data | Jun 19, 2018
America’s housing market still falls short of providing affordable shelter to many
The latest report from the Joint Center for Housing Studies laments the paucity of subsidies to relieve cost burdens of ownership and renting.

Market Data | Jun 18, 2018
AI is the path to maximum profitability for retail and FMCG firms
Leading retailers including Amazon, Alibaba, Lowe’s and Tesco are developing their own AI solutions for automation, analytics and robotics use cases.

Market Data | Jun 12, 2018
Yardi Matrix report details industrial sector's strength
E-commerce and biopharmaceutical companies seeking space stoke record performances across key indicators.
Market Data | Jun 8, 2018
Dodge Momentum Index inches up in May
May’s gain was the result of a 4.7% increase by the commercial component of the Momentum Index.
Market Data | Jun 4, 2018
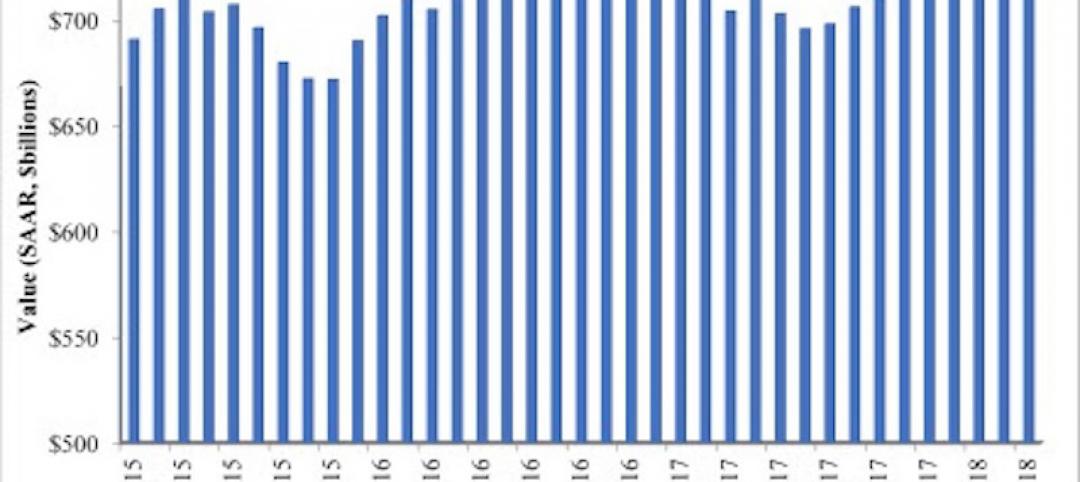
Nonresidential construction remains unchanged in April
Private sector spending increased 0.8% on a monthly basis and is up 5.3% from a year ago.
Market Data | May 30, 2018
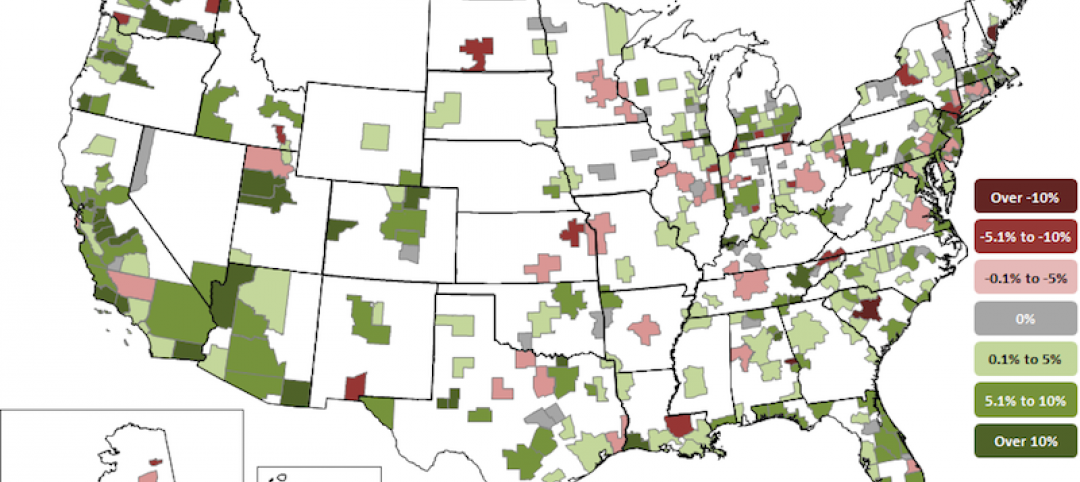
Construction employment increases in 256 metro areas between April 2017 & 2018
Dallas-Plano-Irving and Midland, Texas experience largest year-over-year gains; St. Louis, Mo.-Ill. and Bloomington, Ill. have biggest annual declines in construction employment amid continuing demand.


