


Nonresidential construction spending dipped in February, falling 1.4% on a monthly basis according to analysis of U.S. Census Bureau data released by Associated Builders and Contractors (ABC).
Spending in the nonresidential sector totaled $690.3 billion on a seasonally adjusted, annualized basis in February. While this represents a step back from January's figure of $700.3 billion (revised down from $701.9 billion), it is still 1.5% higher than the level of spending registered in December 2015 and 10.1% higher than February 2015.
"February's weather was particularly harsh in certain parts of the country, including in the economic activity-rich Mid-Atlantic region, and that appears to have had an undue effect on construction spending data," ABC Chief Economist Anirban Basu said. "February data are always difficult to interpret, and the latest nonresidential construction spending figures are no different. Seasonal factors have also made state-level data very difficult to interpret.
"Beyond meteorological considerations, there are other reasons not to be alarmed by February's decline in nonresidential construction spending," Basu said. "Today's positive construction employment report indicates continued economic growth. Moreover, much of the decline in volume was attributable to manufacturing, but the ISM manufacturing index recently crossed the threshold 50 level, indicating that domestic manufacturing is now expanding for the first time in seven months."

Eight of the 16 nonresidential subsectors experienced spending decreases in February, though almost half of the total decline in spending is attributable to the 5.9% decline in manufacturing-related spending.
The following 16 nonresidential construction sectors experienced spending increases in February on a monthly basis:
- Spending in the amusement and recreation category climbed 0.4% from January and is up 13.7% from February 2015.
- Lodging-related spending is up 0.4% for the month and is up 30.1% on a year-ago basis.
- Water supply-related spending expanded 1.9% on a monthly basis and 3.2% on a yearly basis.
- Spending in the office category grew 3.8% from January and is up 25.3% on a year-ago basis.
- Transportation-related spending expanded 0.5% month-over-month and 5.8% year-over-year.
- Health care-related spending expanded 2% from January and is up 3.3% from February 2015.
- Public safety-related spending is up 1.8% for the month, but is down 5.3% for the year.
- Commercial-related construction spending inched 0.1% higher for the month and grew 11% for the year.
Spending in eight of the nonresidential construction subsectors fell in February on a monthly basis:
- Educational-related construction spending fell 2.4% from January, but has expanded 8.5% on a yearly basis.
- Communication-related spending fell 15% month-over-month, but expanded 11.8% year-over-year.
- Spending in the highway and street category fell 2% from January, but is 24.5 higher than one year ago.
- Sewage and waste disposal-related spending fell 2.4% for the month, but is up 2.3% for the year.
- Conservation and development-related spending is 4.6% lower on a monthly basis and 16.8% lower on a year-over-year basis.
- Spending in the religious category fell 4% for the month and is up just 0.7% for the year.
- Manufacturing-related spending fell 5.9% on a monthly basis and is up only 0.8% on a yearly basis.
- Spending in the power category fell 0.6% from January, but is 4.8% higher than one year ago.
Related Stories

Contractors | Jul 13, 2023
Construction input prices remain unchanged in June, inflation slowing
Construction input prices remained unchanged in June compared to the previous month, according to an Associated Builders and Contractors analysis of U.S. Bureau of Labor Statistics Producer Price Index data released today. Nonresidential construction input prices were also unchanged for the month.

Contractors | Jul 11, 2023
The average U.S. contractor has 8.9 months worth of construction work in the pipeline, as of June 2023
Associated Builders and Contractors reported that its Construction Backlog Indicator remained unchanged at 8.9 months in June 2023, according to an ABC member survey conducted June 20 to July 5. The reading is unchanged from June 2022.

Market Data | Jul 5, 2023
Nonresidential construction spending decreased in May, its first drop in nearly a year
National nonresidential construction spending decreased 0.2% in May, according to an Associated Builders and Contractors analysis of data published today by the U.S. Census Bureau. On a seasonally adjusted annualized basis, nonresidential spending totaled $1.06 trillion.

Apartments | Jun 27, 2023
Average U.S. apartment rent reached all-time high in May, at $1,716
Multifamily rents continued to increase through the first half of 2023, despite challenges for the sector and continuing economic uncertainty. But job growth has remained robust and new households keep forming, creating apartment demand and ongoing rent growth. The average U.S. apartment rent reached an all-time high of $1,716 in May.

Industry Research | Jun 15, 2023
Exurbs and emerging suburbs having fastest population growth, says Cushman & Wakefield
Recently released county and metro-level population growth data by the U.S. Census Bureau shows that the fastest growing areas are found in exurbs and emerging suburbs.

Contractors | Jun 13, 2023
The average U.S. contractor has 8.9 months worth of construction work in the pipeline, as of May 2023
Associated Builders and Contractors reported that its Construction Backlog Indicator remained unchanged at 8.9 months in May, according to an ABC member survey conducted May 20 to June 7. The reading is 0.1 months lower than in May 2022. Backlog in the infrastructure category ticked up again and has now returned to May 2022 levels. On a regional basis, backlog increased in every region but the Northeast.

Industry Research | Jun 13, 2023
Two new surveys track how the construction industry, in the U.S. and globally, is navigating market disruption and volatility
The surveys, conducted by XYZ Reality and KPMG International, found greater willingness to embrace technology, workplace diversity, and ESG precepts.
| Jun 5, 2023
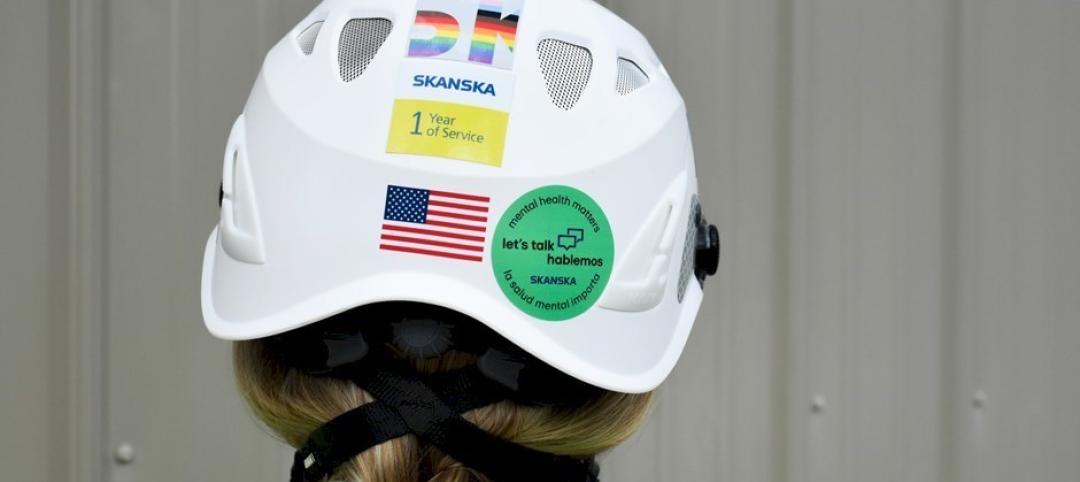
Communication is the key to AEC firms’ mental health programs and training
The core of recent awareness efforts—and their greatest challenge—is getting workers to come forward and share stories.

Contractors | May 24, 2023
The average U.S. contractor has 8.9 months worth of construction work in the pipeline, as of April 2023
Contractor backlogs climbed slightly in April, from a seven-month low the previous month, according to Associated Builders and Contractors.

Multifamily Housing | May 23, 2023
One out of three office buildings in largest U.S. cities are suitable for residential conversion
Roughly one in three office buildings in the largest U.S. cities are well suited to be converted to multifamily residential properties, according to a study by global real estate firm Avison Young. Some 6,206 buildings across 10 U.S. cities present viable opportunities for conversion to residential use.


