

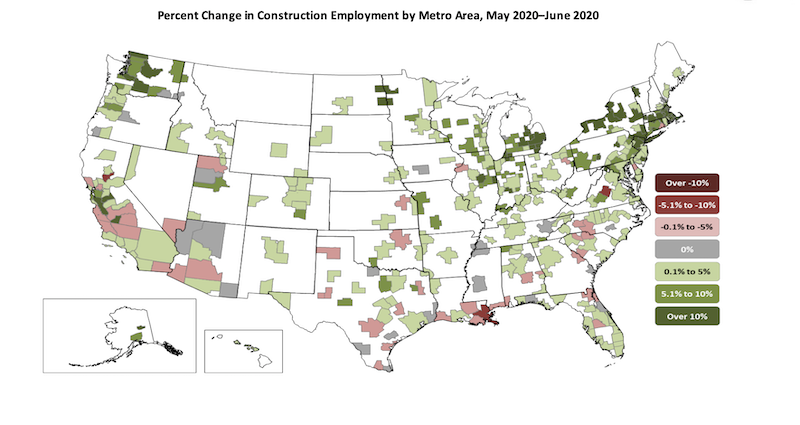
Construction employment decreased in 225, or 62%, out of 358 metro areas between June 2019 and last month despite widespread increases from May to June, according to an analysis of new government data that the Associated General Contractors of America released today. Association officials urged government officials to enact liability reform, boost infrastructure investments and extend tax credits to help the industry recover and rebuild.
“It’s troubling to see construction employment lagging year-ago levels in most locations, in spite of a strong rebound in May and June,” said Ken Simonson, the association’s chief economist. “Those gains were not enough to erase the huge losses in March and April. Many indicators since the employment data were collected in mid-June suggest construction employment will soon decline, or stagnate at best, in much of the country.”
Simonson noted that construction employment was stagnant in 39 metro areas and increased in only 94 areas (26%) over the past 12 months. Eighteen metros had all-time lows for June construction employment, while 28 areas had record highs for June, in data going back to 1990 for most areas.
New York City lost the most construction jobs over 12 months (-38,200 jobs, -24%) despite having the largest gain from May to June. Brockton-Bridgewater-Easton, Mass. had the largest percentage decline: -37% (-2,200 jobs). Austin-Round Rock, Texas added the most construction jobs from June 2019 to June 2020: 4,100 jobs (6%). Walla Walla, Wash. had the highest percentage increase: 27% (300 jobs).
From May to June—a month when construction employment typically increases in most metro areas, 291 metros added construction employees; 42 areas had a decrease; and employment was unchanged in 25 areas. New York City added the most construction jobs between May and June: 22,100 or 22%. The largest percentage increase occurred in Monroe, Mich.: 31% (500 jobs). New Orleans-Metairie La. lost the most jobs during the month: -1,500 jobs (-6%). The largest percentage loss was in Yuba City, Calif.: -10% (-300 jobs).
Association officials noted that Senate Republican leaders released a new coronavirus recovery measure earlier this week that includes provisions that can help construction firms rebuild their payrolls. These include liability reforms so construction firms that are protecting workers from the coronavirus will not be subject to needless litigation. The proposal also includes improvement to the Paycheck Protection Program and an expansion of the Employee Retention Tax Credit the association supports.
“While the measure also addresses unemployment insurance and workforce development, it fails to include the kind of infrastructure funding needed to rebuild our economy” said Stephen E. Sandherr, the association’s chief executive officer. “That new funding is needed to address state transportation funding shortfalls, fix aging public facilities and help retrofit structures to protect students and others from the coronavirus.”
View the metro employment 1-month data, rankings, top 10, map and 12-month data, rankings, top 10, and map.
Related Stories

Contractors | Oct 19, 2023
Crane Index indicates slowing private-sector construction
Private-sector construction in major North American cities is slowing, according to the latest RLB Crane Index. The number of tower cranes in use declined 10% since the first quarter of 2023. The index, compiled by consulting firm Rider Levett Bucknall (RLB), found that only two of 14 cities—Boston and Toronto—saw increased crane counts.

Market Data | Oct 2, 2023
Nonresidential construction spending rises 0.4% in August 2023, led by manufacturing and public works sectors
National nonresidential construction spending increased 0.4% in August, according to an Associated Builders and Contractors analysis of data published today by the U.S. Census Bureau. On a seasonally adjusted annualized basis, nonresidential spending totaled $1.09 trillion.

Giants 400 | Sep 28, 2023
Top 100 University Building Construction Firms for 2023
Turner Construction, Whiting-Turner Contracting Co., STO Building Group, Suffolk Construction, and Skanska USA top BD+C's ranking of the nation's largest university sector contractors and construction management firms for 2023, as reported in Building Design+Construction's 2023 Giants 400 Report. Note: This ranking includes revenue for all university/college-related buildings except student residence halls, sports/recreation facilities, laboratories, S+T-related buildings, parking facilities, and performing arts centers (revenue for those buildings are reported in their respective Giants 400 ranking).

Construction Costs | Sep 28, 2023
U.S. construction market moves toward building material price stabilization
The newly released Quarterly Construction Cost Insights Report for Q3 2023 from Gordian reveals material costs remain high compared to prior years, but there is a move towards price stabilization for building and construction materials after years of significant fluctuations. In this report, top industry experts from Gordian, as well as from Gilbane, McCarthy Building Companies, and DPR Construction weigh in on the overall trends seen for construction material costs, and offer innovative solutions to navigate this terrain.

Data Centers | Sep 21, 2023
North American data center construction rises 25% to record high in first half of 2023, driven by growth of artificial intelligence
CBRE’s latest North American Data Center Trends Report found there is 2,287.6 megawatts (MW) of data center supply currently under construction in primary markets, reaching a new all-time high with more than 70% already preleased.

Contractors | Sep 12, 2023
The average U.S. contractor has 9.2 months worth of construction work in the pipeline, as of August 2023
Associated Builders and Contractors' Construction Backlog Indicator declined to 9.2 months in August, down 0.1 month, according to an ABC member survey conducted from Aug. 21 to Sept. 6. The reading is 0.5 months above the August 2022 level.

Contractors | Sep 11, 2023
Construction industry skills shortage is contributing to project delays
Relatively few candidates looking for work in the construction industry have the necessary skills to do the job well, according to a survey of construction industry managers by the Associated General Contractors of America (AGC) and Autodesk.
Market Data | Sep 6, 2023
Far slower construction activity forecast in JLL’s Midyear update
The good news is that market data indicate total construction costs are leveling off.

Giants 400 | Sep 5, 2023
Top 80 Construction Management Firms for 2023
Alfa Tech, CBRE Group, Skyline Construction, Hill International, and JLL top the rankings of the nation's largest construction management (as agent) and program/project management firms for nonresidential buildings and multifamily housing work, as reported in Building Design+Construction's 2023 Giants 400 Report.

Giants 400 | Sep 5, 2023
Top 150 Contractors for 2023
Turner Construction, STO Building Group, DPR Construction, Whiting-Turner Contracting Co., and Clark Group head the ranking of the nation's largest general contractors, CM at risk firms, and design-builders for nonresidential buildings and multifamily buildings work, as reported in Building Design+Construction's 2023 Giants 400 Report.


