

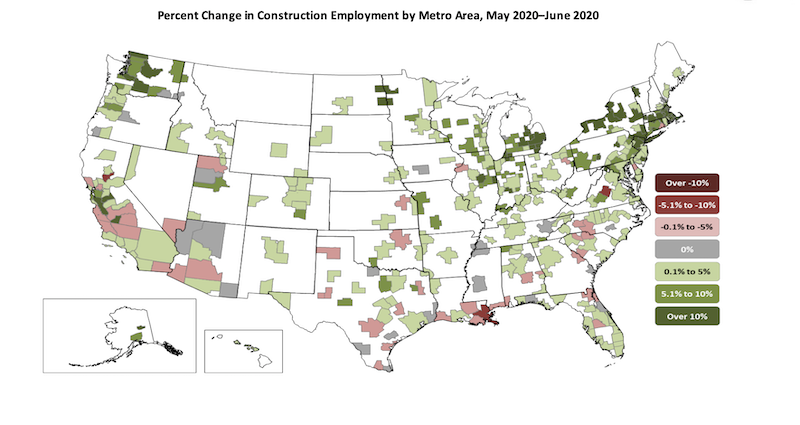
Construction employment decreased in 225, or 62%, out of 358 metro areas between June 2019 and last month despite widespread increases from May to June, according to an analysis of new government data that the Associated General Contractors of America released today. Association officials urged government officials to enact liability reform, boost infrastructure investments and extend tax credits to help the industry recover and rebuild.
“It’s troubling to see construction employment lagging year-ago levels in most locations, in spite of a strong rebound in May and June,” said Ken Simonson, the association’s chief economist. “Those gains were not enough to erase the huge losses in March and April. Many indicators since the employment data were collected in mid-June suggest construction employment will soon decline, or stagnate at best, in much of the country.”
Simonson noted that construction employment was stagnant in 39 metro areas and increased in only 94 areas (26%) over the past 12 months. Eighteen metros had all-time lows for June construction employment, while 28 areas had record highs for June, in data going back to 1990 for most areas.
New York City lost the most construction jobs over 12 months (-38,200 jobs, -24%) despite having the largest gain from May to June. Brockton-Bridgewater-Easton, Mass. had the largest percentage decline: -37% (-2,200 jobs). Austin-Round Rock, Texas added the most construction jobs from June 2019 to June 2020: 4,100 jobs (6%). Walla Walla, Wash. had the highest percentage increase: 27% (300 jobs).
From May to June—a month when construction employment typically increases in most metro areas, 291 metros added construction employees; 42 areas had a decrease; and employment was unchanged in 25 areas. New York City added the most construction jobs between May and June: 22,100 or 22%. The largest percentage increase occurred in Monroe, Mich.: 31% (500 jobs). New Orleans-Metairie La. lost the most jobs during the month: -1,500 jobs (-6%). The largest percentage loss was in Yuba City, Calif.: -10% (-300 jobs).
Association officials noted that Senate Republican leaders released a new coronavirus recovery measure earlier this week that includes provisions that can help construction firms rebuild their payrolls. These include liability reforms so construction firms that are protecting workers from the coronavirus will not be subject to needless litigation. The proposal also includes improvement to the Paycheck Protection Program and an expansion of the Employee Retention Tax Credit the association supports.
“While the measure also addresses unemployment insurance and workforce development, it fails to include the kind of infrastructure funding needed to rebuild our economy” said Stephen E. Sandherr, the association’s chief executive officer. “That new funding is needed to address state transportation funding shortfalls, fix aging public facilities and help retrofit structures to protect students and others from the coronavirus.”
View the metro employment 1-month data, rankings, top 10, map and 12-month data, rankings, top 10, and map.
Related Stories

Hotel Facilities | Jan 22, 2024
U.S. hotel construction is booming, with a record-high 5,964 projects in the pipeline
The hotel construction pipeline hit record project counts at Q4, with the addition of 260 projects and 21,287 rooms over last quarter, according to Lodging Econometrics.

Multifamily Housing | Jan 15, 2024
Multifamily rent growth rate unchanged at 0.3%
The National Multifamily Report by Yardi Matrix highlights the highs and lows of the multifamily market in 2023. Despite strong demand, rent growth remained unchanged at 0.3 percent.

Self-Storage Facilities | Jan 5, 2024
The state of self-storage in early 2024
As the housing market cools down, storage facilities suffer from lower occupancy and falling rates, according to the December 2023 Yardi Matrix National Self Storage Report.

Designers | Dec 25, 2023
Redefining the workplace is a central theme in Gensler’s latest Design Report
The firm identifies eight mega trends that mostly stress human connections.

Contractors | Dec 12, 2023
The average U.S. contractor has 8.5 months worth of construction work in the pipeline, as of November 2023
Associated Builders and Contractors reported today that its Construction Backlog Indicator inched up to 8.5 months in November from 8.4 months in October, according to an ABC member survey conducted Nov. 20 to Dec. 4. The reading is down 0.7 months from November 2022.

Market Data | Nov 27, 2023
Number of employees returning to the office varies significantly by city
While the return-to-the-office trend is felt across the country, the percentage of employees moving back to their offices varies significantly according to geography, according to Eptura’s Q3 Workplace Index.

Market Data | Nov 14, 2023
The average U.S. contractor has 8.4 months worth of construction work in the pipeline, as of September 2023
Associated Builders and Contractors reported that its Construction Backlog Indicator declined to 8.4 months in October from 9.0 months in September, according to an ABC member survey conducted from Oct. 19 to Nov. 2. The reading is down 0.4 months from October 2022. Backlog now stands at its lowest level since the first quarter of 2022.

Multifamily Housing | Nov 9, 2023
Multifamily project completions forecast to slow starting 2026
Yardi Matrix has released its Q4 2023 Multifamily Supply Forecast, emphasizing a short-term spike and plateau of new construction.

Contractors | Nov 1, 2023
Nonresidential construction spending increases for the 16th straight month, in September 2023
National nonresidential construction spending increased 0.3% in September, according to an Associated Builders and Contractors analysis of data published today by the U.S. Census Bureau. On a seasonally adjusted annualized basis, nonresidential spending totaled $1.1 trillion.

Market Data | Oct 23, 2023
New data finds that the majority of renters are cost-burdened
The most recent data derived from the 2022 Census American Community Survey reveals that the proportion of American renters facing housing cost burdens has reached its highest point since 2012, undoing the progress made in the ten years leading up to the pandemic.


