


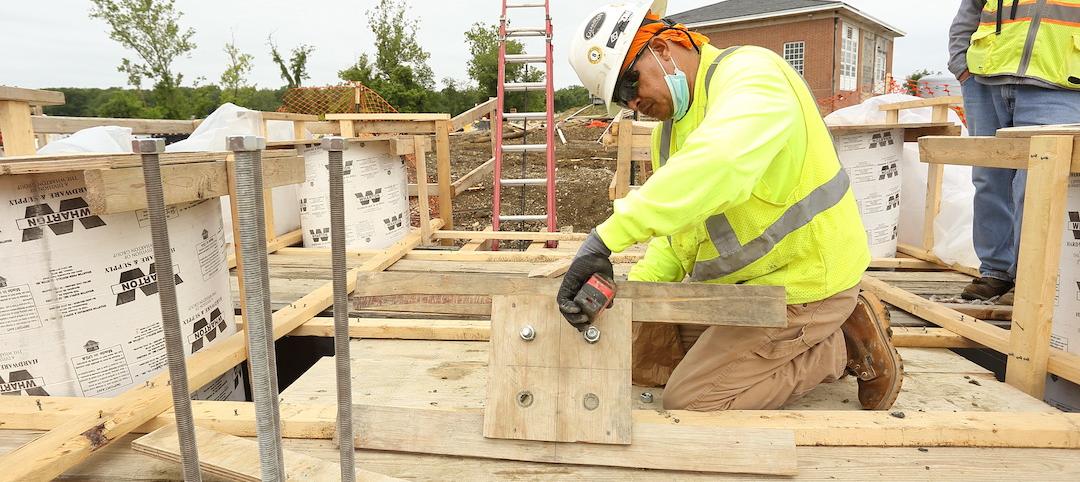
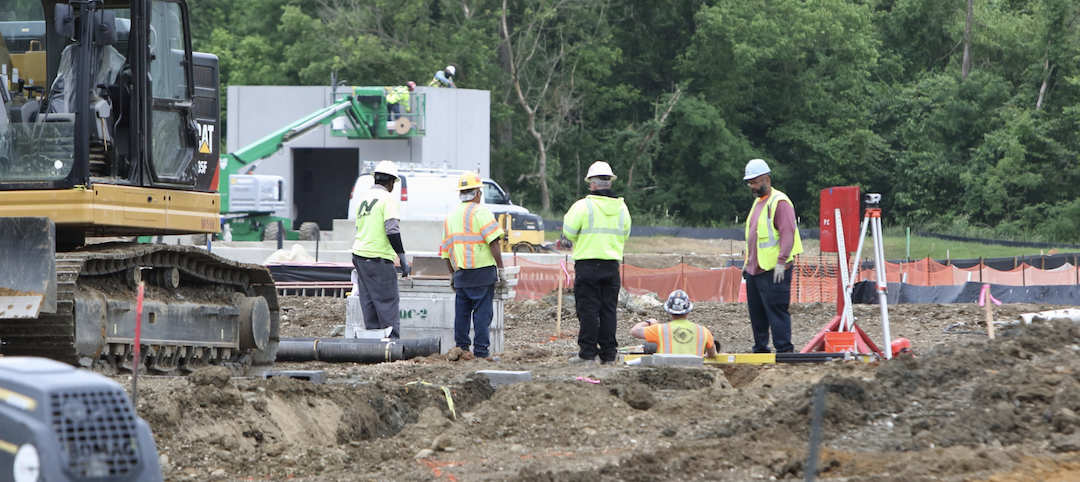
Analysts at Lodging Econometrics (LE) report that in the third quarter of 2021 the total U.S. construction pipeline stands at 4,837 projects/592,259 rooms, down 8% by projects and 10% by rooms year-over-year (YOY). While project numbers have seen a slight increase over second quarter totals, overall, the construction pipeline remains largely muted due to a reduced inflow of new projects in the pipeline as compared to “pre-COVID levels,” and significant hotel openings during the first half of the year which exited the pipeline. The prolonged effects of the pandemic, above average inflation, rising interest rates, and material shortages and price increases have been and will continue to be key factors in decision-making for developers through the end of the year.
However, many developers really do have a long term positive outlook on hotel development as projects in the early planning stage are up considerably, with 1,978 projects/239,831 rooms, a 27% increase by projects and 25% by rooms YOY and reaching a cyclical peak this quarter. Conversely, projects scheduled to start construction in the next 12 months are down 14% by projects and 15% by rooms YOY, with 1,824 projects/210,189 rooms at the end of the third quarter. Projects under construction were also down in Q3, ending the quarter at 1,035 projects/142,239 rooms. This is largely due to projects that have completed construction and have opened. Presently, inflation and the increasing cost and sourcing of labor and materials, combined with supply chain shortages and delays, continue to be a major variable for hotel development. In response, developers are reworking budgets, revising plans to minimize costs, and adjusting construction start and project opening dates to endure the challenges of a recovering industry.
Though the path to full recovery may be longer than originally expected, two main steppingstones aiding in the recovery have been the recent rise in hotel stock values as well as increases in lending activity. Rebounding hotel stocks and better-than-expected hotel and travel demand throughout the summer season has renewed developer sentiment.
Renovation and conversion pipeline activity remains steady at the end of Q3 ‘21, with conversion projects hitting a cyclical peak, and ending the quarter at 752 projects/79,024 rooms. Combined, renovation and conversion activity accounts for 1,253 projects and 176,305 rooms.
Through the third quarter of 2021, the U.S. opened 665 new hotels with 85,306 rooms with another 221 projects/23,026 rooms anticipated to open by the end of the year, totaling 886 projects/108,332 rooms for 2021. Our research analysts expect an increase in new hotel openings in 2022, with 970 projects accounting for 110,123 rooms forecast to open in 2022 and another 961 projects/111,249 rooms anticipated to open in 2023.
Related Stories

Market Data | Jan 6, 2022
A new survey offers a snapshot of New York’s construction market
Anchin’s poll of 20 AEC clients finds a “growing optimism,” but also multiple pressure points.
Market Data | Jan 3, 2022
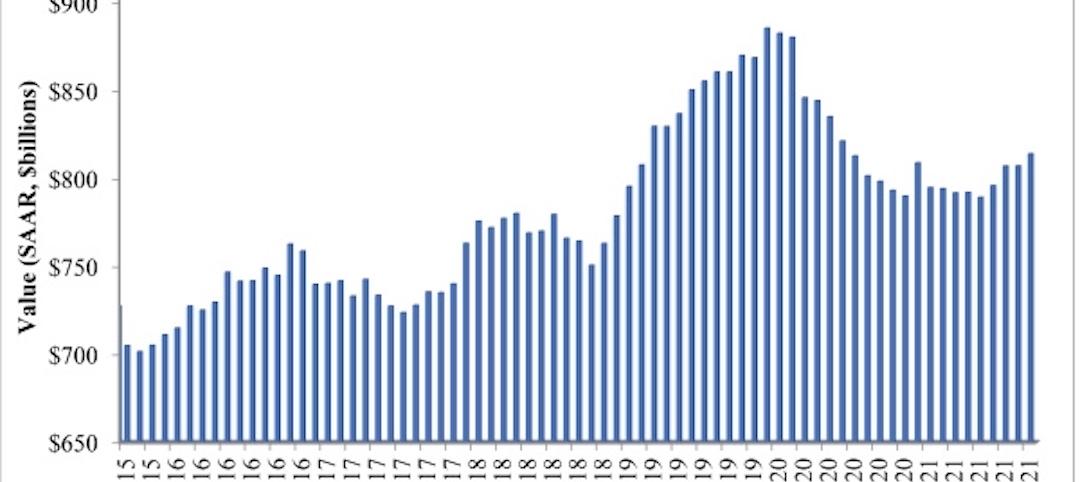
Construction spending in November increases from October and year ago
Construction spending in November totaled $1.63 trillion at a seasonally adjusted annual rate.

Market Data | Dec 22, 2021
Two out of three metro areas add construction jobs from November 2020 to November 2021
Construction employment increased in 237 or 66% of 358 metro areas over the last 12 months.
Market Data | Dec 17, 2021
Construction jobs exceed pre-pandemic level in 18 states and D.C.
Firms struggle to find qualified workers to keep up with demand.
Market Data | Dec 15, 2021
Widespread steep increases in materials costs in November outrun prices for construction projects
Construction officials say efforts to address supply chain challenges have been insufficient.

Market Data | Dec 15, 2021
Demand for design services continues to grow
Changing conditions could be on the horizon.

Market Data | Dec 5, 2021
Construction adds 31,000 jobs in November
Gains were in all segments, but the industry will need even more workers as demand accelerates.
Market Data | Dec 5, 2021
Construction spending rebounds in October
Growth in most public and private nonresidential types is offsetting the decline in residential work.
Market Data | Dec 5, 2021
Nonresidential construction spending increases nearly 1% in October
Spending was up on a monthly basis in 13 of the 16 nonresidential subcategories.
Market Data | Nov 30, 2021
Two-thirds of metro areas add construction jobs from October 2020 to October 2021
The pandemic and supply chain woes may limit gains.


