


At the close of 2021’s second quarter, analysts at Lodging Econometrics (LE) report that the total U.S. construction pipeline stands at 4,787 projects/598,111 rooms, down 14% Year-Over-Year (YOY) by projects from Q2 2020’s 5,582 projects/687,801 rooms. This decline in pipeline totals YOY is largely a result of projects that were delayed in the under construction phase of the pipeline as a result of COVID, now having exited the pipeline and opened.
During the first and second quarters of 2021, the U.S. opened 472 new hotels with 59,034 rooms. LE is forecasting another 450 projects/51,754 rooms to open during 2021 for a total of 922 projects/110,788 rooms by year-end. This will represent a 2.0% increase in new supply for 2021. 1,008 projects/113,871 rooms are expected to open in 2022, representing a 2.0% increase in new supply for 2022. And, announcing for the first time this quarter is LE’s forecast for 2023, which LE is expecting 997 projects/115,271 rooms to open. This is again a 2.0% increase in new supply.
Following a nearly 16-month hiatus related to COVID-19 shutdowns, the first half of 2021 saw a substantial uptick in hotel bookings and travel reservation numbers. As vaccination rates rise and travel restrictions ease, consumer confidence continues to increase, and booking numbers move toward pre-pandemic levels. As demand increases, new hotel project announcements will soon follow. There were a total of 372 new projects accounting for 45,084 rooms announced into the pipeline in the first half of 2021. Of those totals, 202 new project announcements with 25,653 rooms occurred in the second quarter. The arrival of summer, a rebounding demand for domestic business and leisure travel, combined with the recent pledge from the U.S. Department of Commerce to invest $750 million in the travel and tourism industries, has investors and developers feeling increasingly optimistic. This confidence has resulted in a 20% increase in new project announcements in Q2 2021 when compared to the second quarter of 2020 when 169 projects/20,359 rooms were recorded.
Projects currently under construction stand at 1,165 projects/159,581 rooms. Projects scheduled to start construction in the next 12 months total 1,843 projects/213,744 rooms. Projects in the early planning stage saw a 25% increase in projects and a 28% increase in rooms YOY, standing at 1,779 projects/224,786 rooms. The increase in projects in the early planning stage reflects a combination of developer’s confidence to initiate new construction projects and the recalibration of some of their timelines for existing projects.
As COVID-19 safety guidelines and restrictions evolve across the country and in anticipation of international travel bans being lifted, more hotels are reestablishing renovation plans, and/or are repositioning their properties with a brand conversion. In the first half of 2021, experts at LE recorded 1,152 active renovation projects/238,110 rooms and 1,181 active conversion projects/128,810 rooms throughout the United States.
Related Stories

Market Data | Apr 30, 2018
Outlook mixed for renewable energy installations in Middle East and Africa region
Several major MEA countries are actively supporting the growth of renewable energy.
Market Data | Apr 12, 2018
Construction costs climb in March as wide range of input costs jump
Association officials urge Trump administration, congress to fund infrastructure adequately as better way to stimulate demand than tariffs that impose steep costs on contractors and project owners.

Market Data | Apr 9, 2018
Construction employers add 228,000 jobs over the year despite dip in March
Average hourly earnings increase to $29.43 in construction, topping private sector by nearly 10%; Association officials urge updating and better funding programs to train workers for construction jobs.
Market Data | Apr 4, 2018
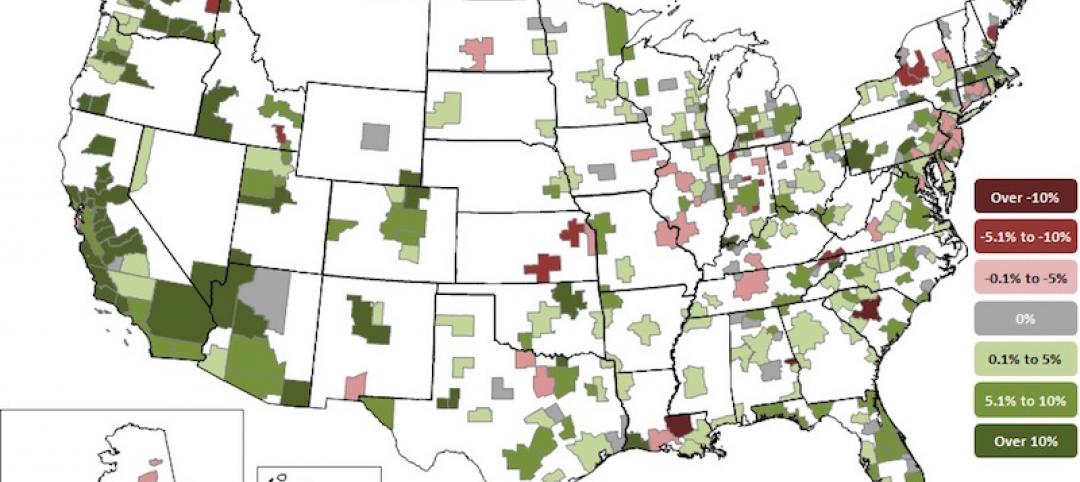
Construction employment increases in 257 metro areas between February 2017 & 2018 as construction firms continue to expand amid strong demand
Riverside-San Bernardino-Ontario, Calif. and Merced, Calif. experience largest year-over-year gains; Baton Rouge, La. and Auburn-Opelika, Ala. have biggest annual declines in construction employment.
Market Data | Apr 2, 2018
Construction spending in February inches up from January
Association officials urge federal, state and local officials to work quickly to put recently enacted funding increases to work to improve aging and over-burdened infrastructure, offset public-sector spending drops.

Market Data | Mar 29, 2018
AIA and the University of Minnesota partner to develop Guides for Equitable Practice
The Guides for Equitable Practice will be developed and implemented in three phase.

Market Data | Mar 22, 2018
Architecture billings continue to hold positive in 2018
Billings particularly strong at firms in the West and Midwest regions.

Market Data | Mar 21, 2018
Construction employment increases in 248 metro areas as new metal tariffs threaten future sector job gains
Riverside-San Bernardino-Ontario, Calif., and Merced, Calif., experience largest year-over-year gains; Baton Rouge, La., and Auburn-Opelika, Ala., have biggest annual declines in construction employment.
Market Data | Mar 19, 2018
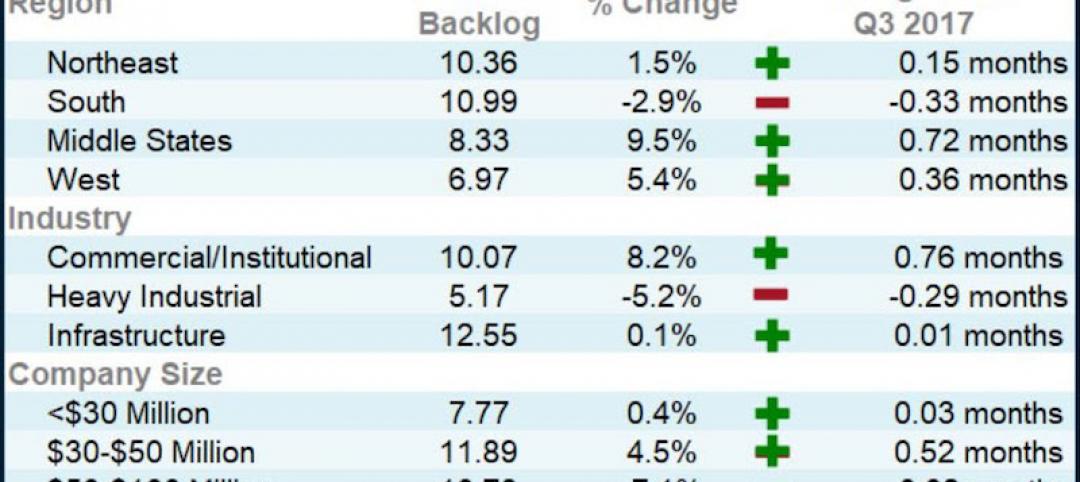
ABC's Construction Backlog Indicator hits a new high: 2018 poised to be a very strong year for construction spending
CBI is up by 1.36 months, or 16.3%, on a year-over-year basis.

Market Data | Mar 15, 2018
ABC: Construction materials prices continue to expand briskly in February
Compared to February 2017, prices are up 5.2%.


