


At the close of 2021’s second quarter, analysts at Lodging Econometrics (LE) report that the total U.S. construction pipeline stands at 4,787 projects/598,111 rooms, down 14% Year-Over-Year (YOY) by projects from Q2 2020’s 5,582 projects/687,801 rooms. This decline in pipeline totals YOY is largely a result of projects that were delayed in the under construction phase of the pipeline as a result of COVID, now having exited the pipeline and opened.
During the first and second quarters of 2021, the U.S. opened 472 new hotels with 59,034 rooms. LE is forecasting another 450 projects/51,754 rooms to open during 2021 for a total of 922 projects/110,788 rooms by year-end. This will represent a 2.0% increase in new supply for 2021. 1,008 projects/113,871 rooms are expected to open in 2022, representing a 2.0% increase in new supply for 2022. And, announcing for the first time this quarter is LE’s forecast for 2023, which LE is expecting 997 projects/115,271 rooms to open. This is again a 2.0% increase in new supply.
Following a nearly 16-month hiatus related to COVID-19 shutdowns, the first half of 2021 saw a substantial uptick in hotel bookings and travel reservation numbers. As vaccination rates rise and travel restrictions ease, consumer confidence continues to increase, and booking numbers move toward pre-pandemic levels. As demand increases, new hotel project announcements will soon follow. There were a total of 372 new projects accounting for 45,084 rooms announced into the pipeline in the first half of 2021. Of those totals, 202 new project announcements with 25,653 rooms occurred in the second quarter. The arrival of summer, a rebounding demand for domestic business and leisure travel, combined with the recent pledge from the U.S. Department of Commerce to invest $750 million in the travel and tourism industries, has investors and developers feeling increasingly optimistic. This confidence has resulted in a 20% increase in new project announcements in Q2 2021 when compared to the second quarter of 2020 when 169 projects/20,359 rooms were recorded.
Projects currently under construction stand at 1,165 projects/159,581 rooms. Projects scheduled to start construction in the next 12 months total 1,843 projects/213,744 rooms. Projects in the early planning stage saw a 25% increase in projects and a 28% increase in rooms YOY, standing at 1,779 projects/224,786 rooms. The increase in projects in the early planning stage reflects a combination of developer’s confidence to initiate new construction projects and the recalibration of some of their timelines for existing projects.
As COVID-19 safety guidelines and restrictions evolve across the country and in anticipation of international travel bans being lifted, more hotels are reestablishing renovation plans, and/or are repositioning their properties with a brand conversion. In the first half of 2021, experts at LE recorded 1,152 active renovation projects/238,110 rooms and 1,181 active conversion projects/128,810 rooms throughout the United States.
Related Stories
Market Data | Aug 16, 2019
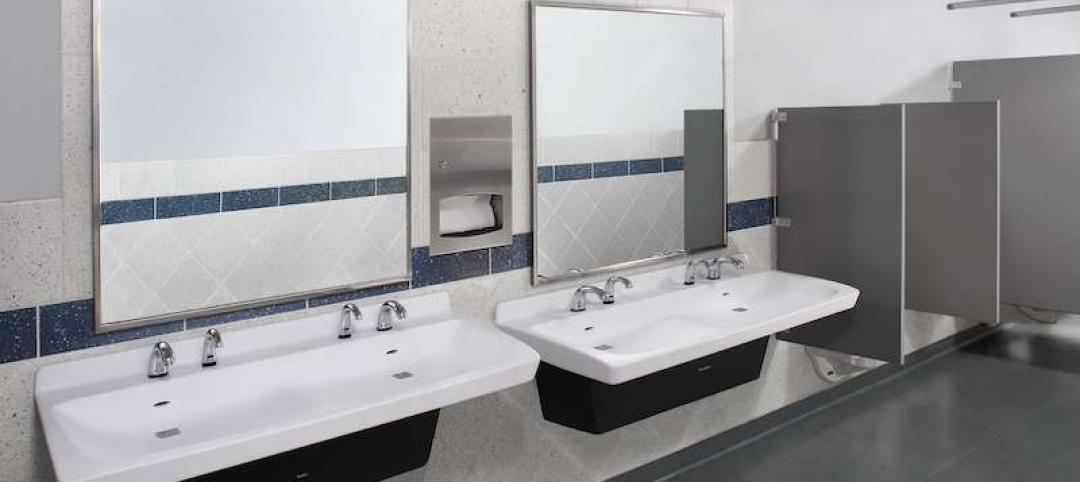
Students say unclean restrooms impact their perception of the school
The findings are part of Bradley Corporation’s Healthy Hand Washing Survey.
Market Data | Aug 12, 2019
Mid-year economic outlook for nonresidential construction: Expansion continues, but vulnerabilities pile up
Emerging weakness in business investment has been hinting at softening outlays.

Market Data | Aug 7, 2019
National office vacancy holds steady at 9.7% in slowing but disciplined market
Average asking rental rate posts 4.2% annual growth.
Market Data | Aug 1, 2019
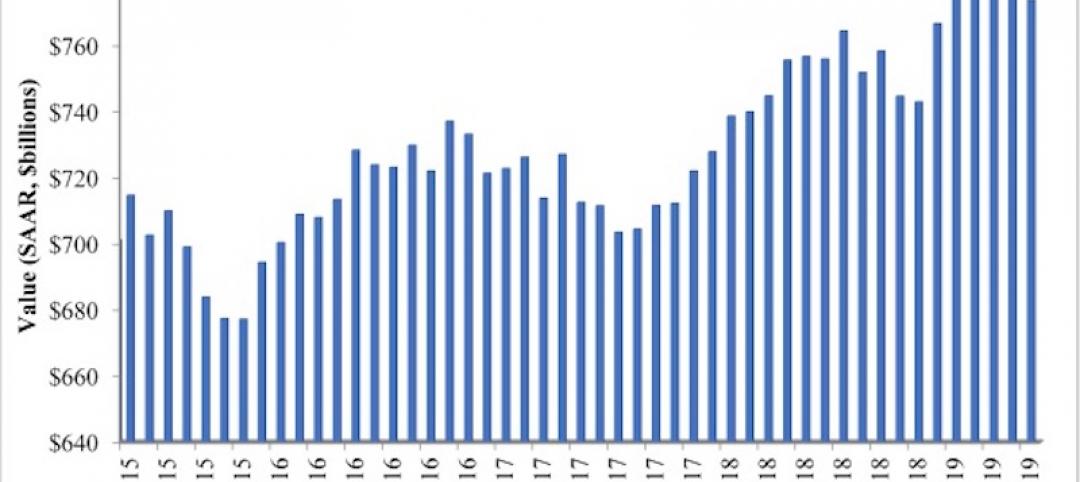
Nonresidential construction spending slows in June, remains elevated
Among the 16 nonresidential construction spending categories tracked by the Census Bureau, seven experienced increases in monthly spending.

Market Data | Jul 31, 2019
For the second quarter of 2019, the U.S. hotel construction pipeline continued its year-over-year growth spurt
The growth spurt continued even as business investment declined for the first time since 2016.
Market Data | Jul 23, 2019
Despite signals of impending declines, continued growth in nonresidential construction is expected through 2020
AIA’s latest Consensus Construction Forecast predicts growth.

Market Data | Jul 20, 2019
Construction costs continued to rise in second quarter
Labor availability is a big factor in that inflation, according to Rider Levett Bucknall report.
Market Data | Jul 18, 2019
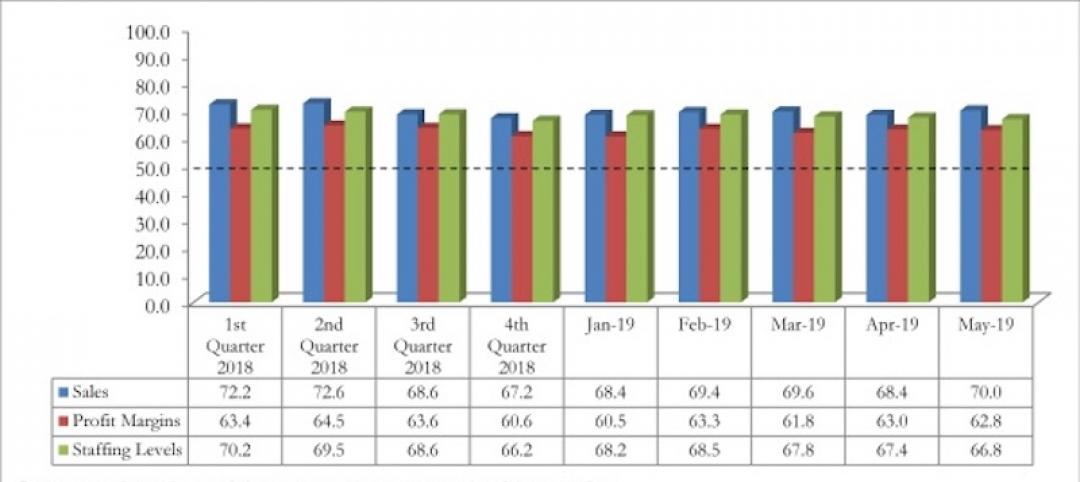
Construction contractors remain confident as summer begins
Contractors were slightly less upbeat regarding profit margins and staffing levels compared to April.
Market Data | Jul 17, 2019
Design services demand stalled in June
Project inquiry gains hit a 10-year low.
Market Data | Jul 16, 2019
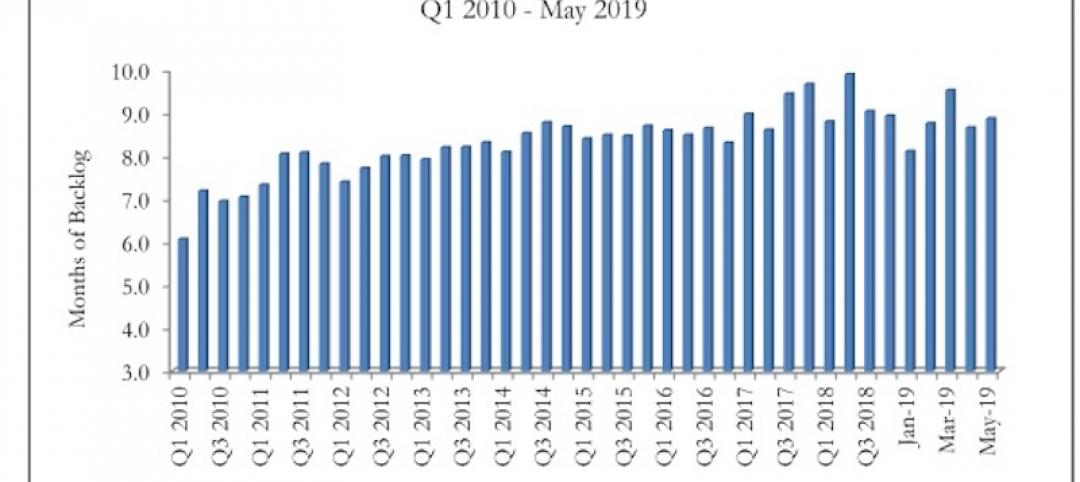
ABC’s Construction Backlog Indicator increases modestly in May
The Construction Backlog Indicator expanded to 8.9 months in May 2019.


