

Following a sizable decrease in demand for design services in March, the April Architecture Billings Index (ABI) climbed back into positive territory according to a new report today from The American Institute of Architects (AIA).
AIA’s ABI score for April showed a small increase in design services at 50.5 in April, which is up from 47.8 in March. Any score above 50 indicates an increase in billings. Additionally, business conditions remained strong at firms located in the South. Despite this and the positive overall billings score, most regional and sector indictors continue to display decreasing demand for design services.
“In contrast to 2018, conditions throughout the construction sector recently have become more unsettled,” said AIA Chief Economist Kermit Baker, PhD, Hon. AIA. “Though we may not be at a critical inflection point, the next several months of billing data will be indicative of the health of the industry going into 2020.”
Key ABI highlights for April include:
— Regional averages: South (51.6); Midwest (49.3); West (49.0); Northeast (45.1)
— Sector index breakdown: mixed practice (53.2); institutional (49.2); multi-family residential (47.4); commercial/industrial (46.6)
— Project inquiries index: 60.9
— Design contracts index: 52.1
The regional and sector categories are calculated as a three-month moving average, whereas the national index, design contracts and inquiries are monthly numbers.
Related Stories
Market Data | Aug 24, 2021
July construction employment lags pre-pandemic peak in 36 states
Delta variant of coronavirus threatens to hold down further gains.

Market Data | Aug 17, 2021
Demand for design activity continues to expand
The ABI score for July was 54.6.

Market Data | Aug 12, 2021
Steep rise in producer prices for construction materials and services continues in July.
The producer price index for new nonresidential construction rose 4.4% over the past 12 months.

Market Data | Aug 6, 2021
Construction industry adds 11,000 jobs in July
Nonresidential sector trails overall recovery.

Market Data | Aug 2, 2021
Nonresidential construction spending falls again in June
The fall was driven by a big drop in funding for highway and street construction and other public work.
Market Data | Jul 29, 2021
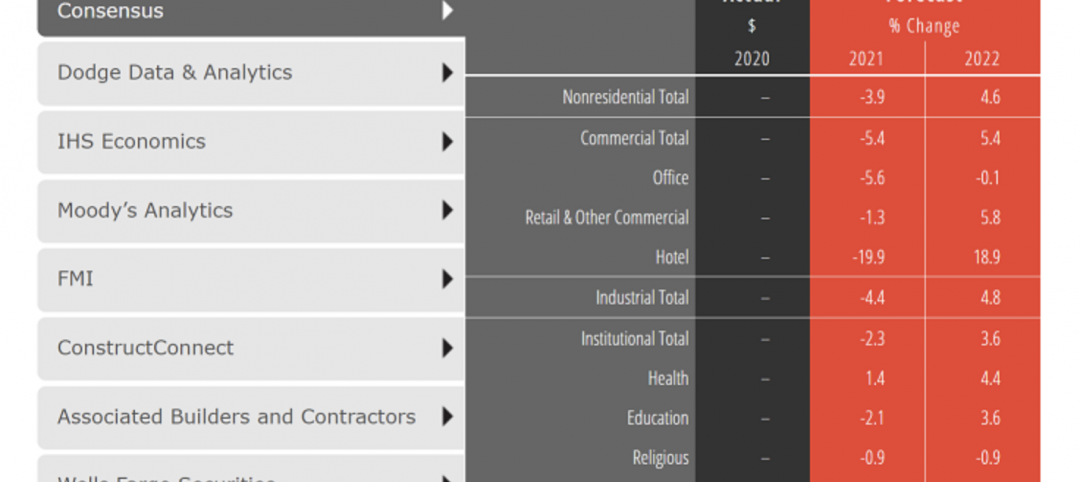
Outlook for construction spending improves with the upturn in the economy
The strongest design sector performers for the remainder of this year are expected to be health care facilities.
Market Data | Jul 29, 2021
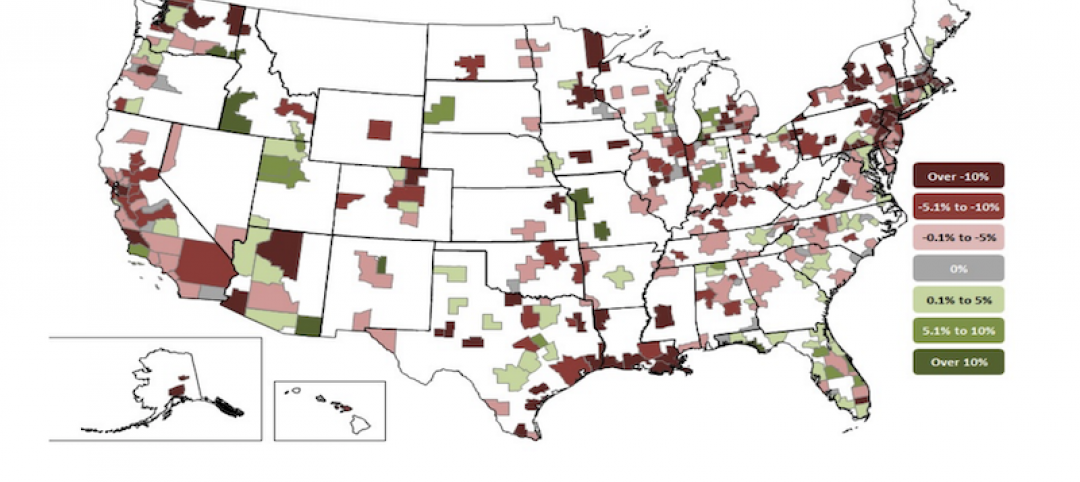
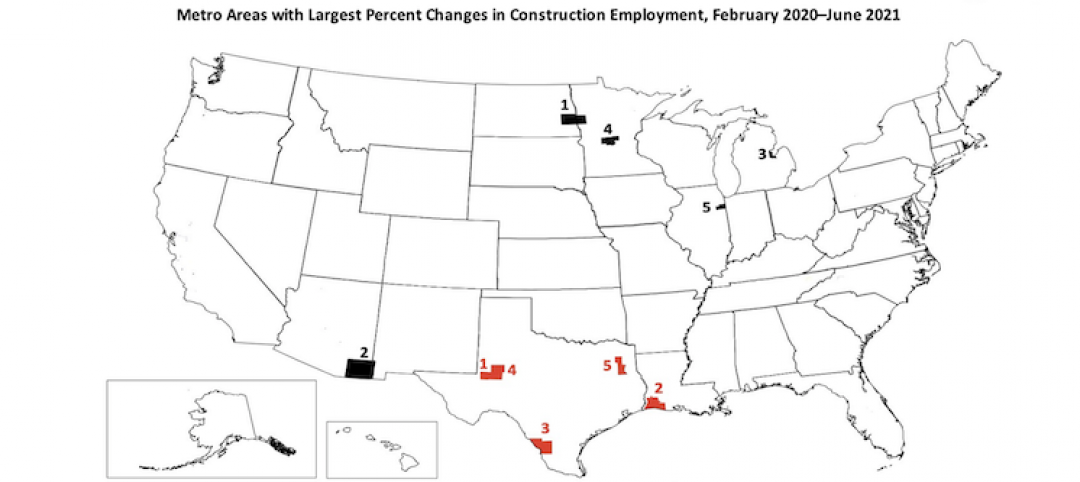
Construction employment lags or matches pre-pandemic level in 101 metro areas despite housing boom
Eighty metro areas had lower construction employment in June 2021 than February 2020.

Market Data | Jul 28, 2021
Marriott has the largest construction pipeline of U.S. franchise companies in Q2‘21
472 new hotels with 59,034 rooms opened across the United States during the first half of 2021.

Market Data | Jul 27, 2021
New York leads the U.S. hotel construction pipeline at the close of Q2‘21
Many hotel owners, developers, and management groups have used the operational downtime, caused by COVID-19’s impact on operating performance, as an opportunity to upgrade and renovate their hotels and/or redefine their hotels with a brand conversion.

Market Data | Jul 26, 2021
U.S. construction pipeline continues along the road to recovery
During the first and second quarters of 2021, the U.S. opened 472 new hotels with 59,034 rooms.


