

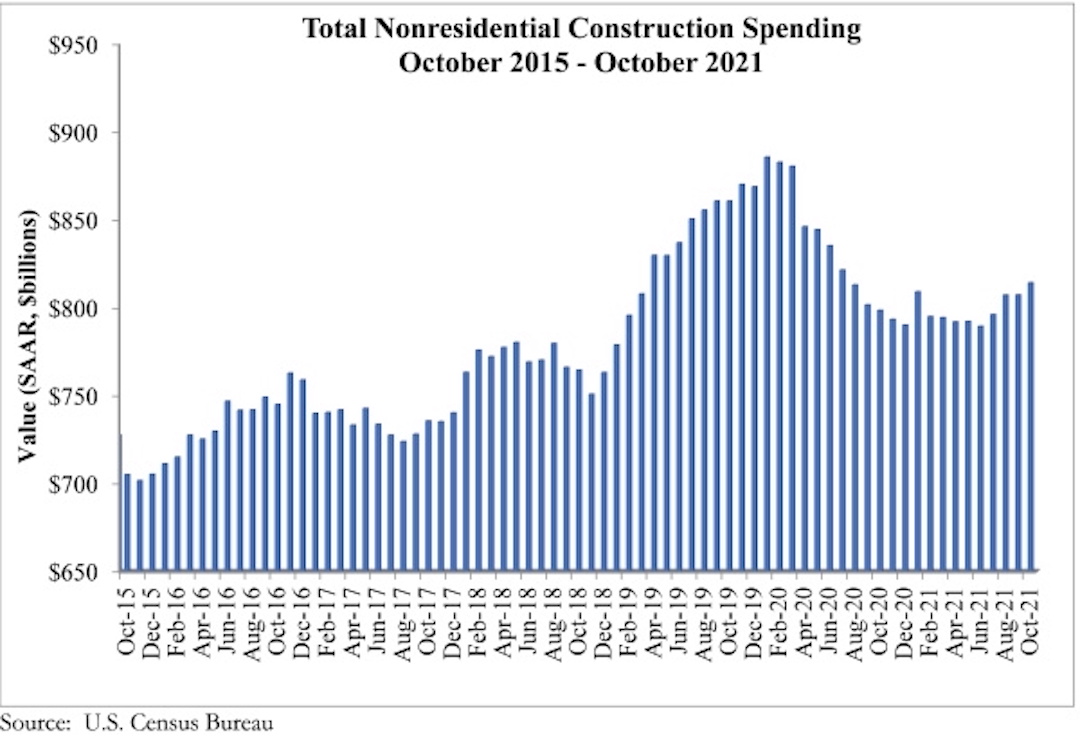
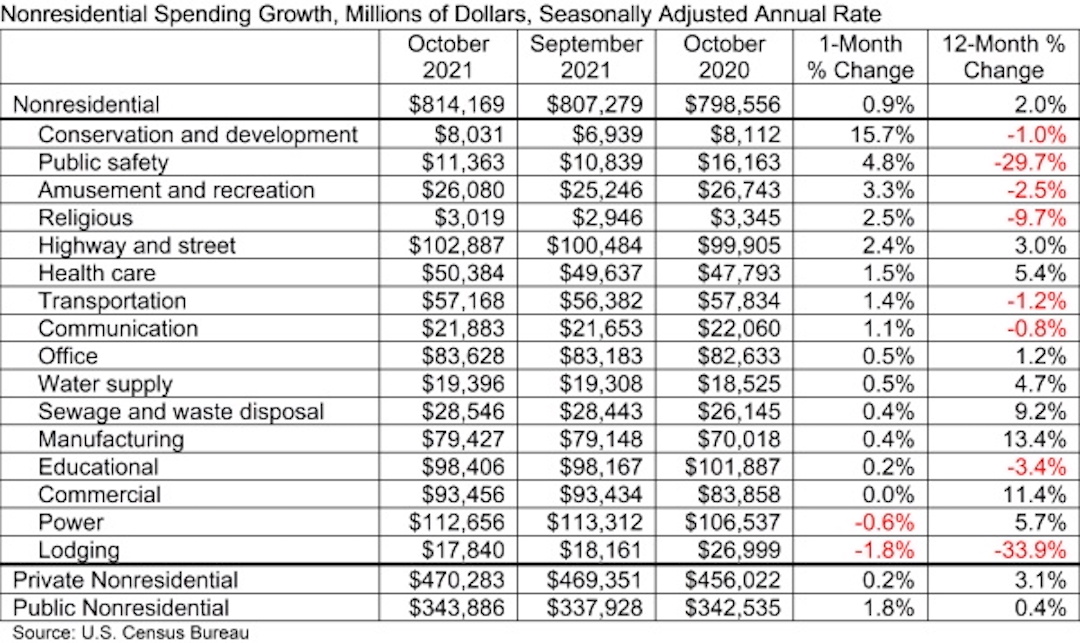
National nonresidential construction spending was up 0.9% in October, according to an Associated Builders and Contractors analysis of data published today by the U.S. Census Bureau. On a seasonally adjusted annualized basis, nonresidential spending totaled $814.2 billion for the month.
Spending was up on a monthly basis in 13 of the 16 nonresidential subcategories, with spending in the commercial subcategory virtually unchanged for the month. Private nonresidential spending was up slightly by 0.2%, while public nonresidential construction spending increased 1.8% in October.
“On the surface, there is much to be encouraged by in October’s construction spending data,” said ABC Chief Economist Anirban Basu. “Nonresidential spending is now at its highest level since July 2020 and has rebounded 3.1% since bottoming out in June 2021. Nonresidential spending expanded meaningfully for the month and those gains were spread across most subsectors. Data characterizing the two prior months were upwardly revised by a combined $27 billion, or 1.7%.
“But construction data do not adjust for inflation, and these spending gains are largely attributable to increases in the cost of delivering construction services,” said Basu. “Challenges that have suppressed nonresidential construction spending growth remain firmly in place. While lofty levels of investment in real estate would normally be associated with significant private construction volumes, many project owners have been induced to postpone projects because of elevated material and labor costs as well as widespread shortages.
“Still, leading indicators remain positive,” said Basu. “ABC members collectively expect revenues and employment levels to climb during the months ahead, according to ABC’s Construction Confidence Index. Design work is plentiful, which means that many investors are at least considering moving forward with projects. In certain geographies, especially in the southern United States, office and other segments are improving, which should translate into more abundant construction starts once global supply chains and materials prices normalize. In this regard, the emergence of the omicron variant adds another layer of uncertainty and may prevent certain materials and equipment prices from declining in the very near term.
“The bottom line is that 2022 should be an excellent year for nonresidential construction,” said Basu. “Performance will be led by public construction, especially in the context of a recently passed and large infrastructure package. Among the segments that are set to zoom ahead are roads and bridges, school construction, water systems, airports, seaports and rail. Traditional office and lodging construction will likely remain weak in much of the nation, however.”

Related Stories

Market Data | Mar 6, 2019
Global hotel construction pipeline hits record high at 2018 year-end
There are a record-high 6,352 hotel projects and 1.17 million rooms currently under construction worldwide.

Market Data | Feb 28, 2019
U.S. economic growth softens in final quarter of 2018
Year-over-year GDP growth was 3.1%, while average growth for 2018 was 2.9%.

Market Data | Feb 20, 2019
Strong start to 2019 for architecture billings
“The government shutdown affected architecture firms, but doesn’t appear to have created a slowdown in the profession,” said AIA Chief Economist Kermit Baker, Hon. AIA, PhD, in the latest ABI report.

Market Data | Feb 19, 2019
ABC Construction Backlog Indicator steady in Q4 2018
CBI reached a record high of 9.9 months in the second quarter of 2018 and averaged about 9.1 months throughout all four quarters of last year.

Market Data | Feb 14, 2019
U.S. Green Building Council announces top 10 countries and regions for LEED green building
The list ranks countries and regions in terms of cumulative LEED-certified gross square meters as of December 31, 2018.

Market Data | Feb 13, 2019
Increasingly tech-enabled construction industry powers forward despite volatility
Construction industry momentum to carry through first half of 2019.

Market Data | Feb 4, 2019
U.S. Green Building Council announces annual Top 10 States for LEED Green Building in 2018
Illinois takes the top spot as USGBC defines the next generation of green building with LEED v4.1.

Market Data | Feb 4, 2019
Nonresidential construction spending dips in November
Total nonresidential spending stood at $751.5 billion on a seasonally adjusted annualized rate.

Market Data | Feb 1, 2019
The year-end U.S. hotel construction pipeline continues steady growth trend
Project counts in the early planning stage continue to rise reaching an all-time high of 1,723 projects/199,326 rooms.

Market Data | Feb 1, 2019
Construction spending is projected to increase by more than 11% through 2022
FMI’s annual outlook also expects the industry’s frantic M&A activity to be leavened by caution going forward.


