

From July through October of 2020, national construction costs rose, on average, by 0.25%, based on 14 markets in North America tracked by the construction consulting firm Rider Levett Bucknall (RLB), which has just released its North America Construction Cost report for the fourth quarter of 2020.
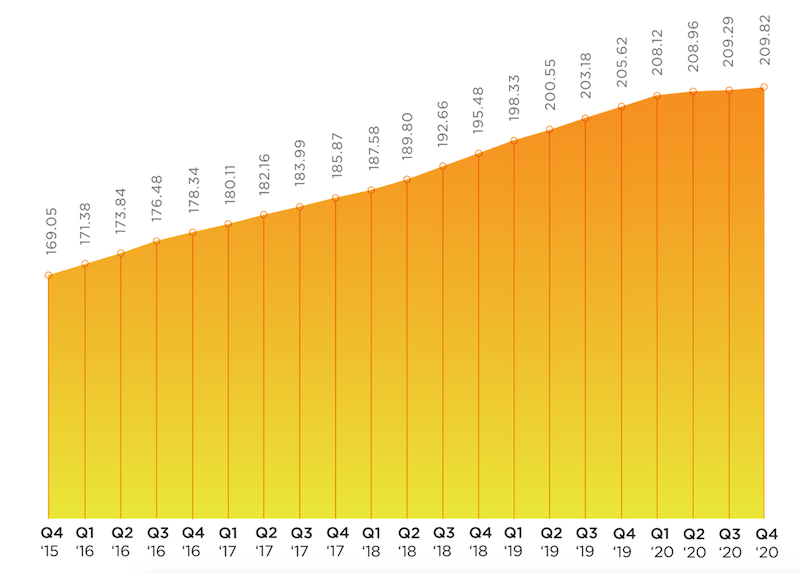
Over the first 10 months of last year, construction spending rose by 3.7% to $1.439 trillion, according to Census Bureau estimates. Construction costs were up by 2.03%. RLB’s National Construction Cost Index stood at 209.82 for the fourth quarter of last year, compared to 205.62 for the same period a year earlier. After rising consistently since the fourth quarter of 2015, RLB’s Index tapered off last year.
The full report can be downloaded from here.
Given the impact of construction activity from the coronavirus pandemic, “the economic damage incurred over the past nine months will take time to heal,” writes Julian Anderson, FRICS, President-North America for RLB.
Anderson expresses concern about lingering unemployment that is “casting a darker shadow over the economy.” He speaks optimistically about President-Elect Joe Biden’s expansive infrastructure plan, whose passage became more likely now that Democrats will control the executive and legislative branches following the election of two Democratic senators in Georgia earlier this month.
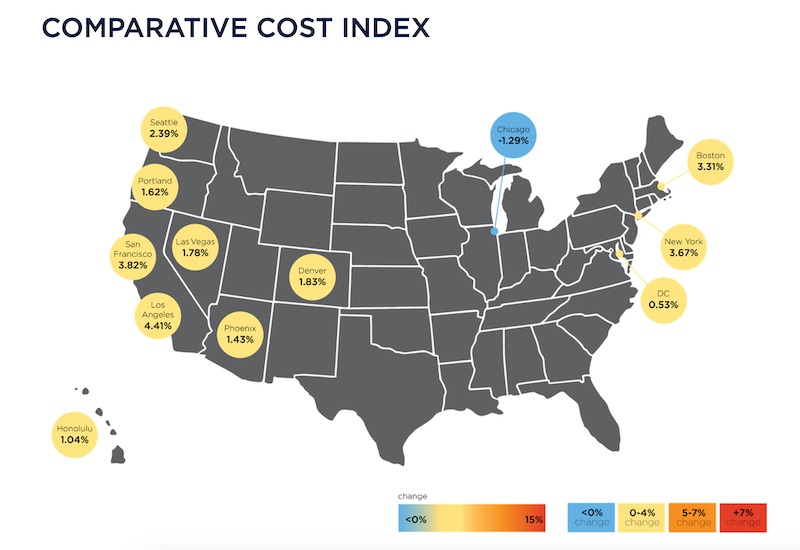
For the most part, inflation is under control in the construction sectors of U.S. metros.
Anderson predicts that Biden’s plan will receive bipartisan support “if it is tied to creating jobs that have been lost due to the pandemic.” The New York Times, quoting Bureau of Labor Statistics estimates, reported on January 9 that 9.4 million jobs were lost in the U.S. in 2020, the worst year since World War II.
Construction unemployment, which spiked in the second quarter when the coronavirus delayed or postponed projects, has recovered of late. The industry gained 51,00 jobs in December, even though the total for the year was down 142,000, or 1.9%. However, a survey that included 1,329 responses, conducted by Associated General Contractors of America (AGC) in every state from Nov. 11 through Dec. 11, found that contractors are generally pessimistic about the outlook for nonresidential and multifamily construction in 2021.
SAN FRANCISCO STILL COSTLIEST MARKET
RLB’s report breaks down its Cost Index by cities and building types. For example, San Francisco, New York, and Boston registered the highest indices for prime office construction. Chicago, Honolulu, and San Francisco had the highest cost indices for five-star hotels. Los Angeles is the most expensive market in which to build hospitals, in part because of California’s seismic mitigation requirements.
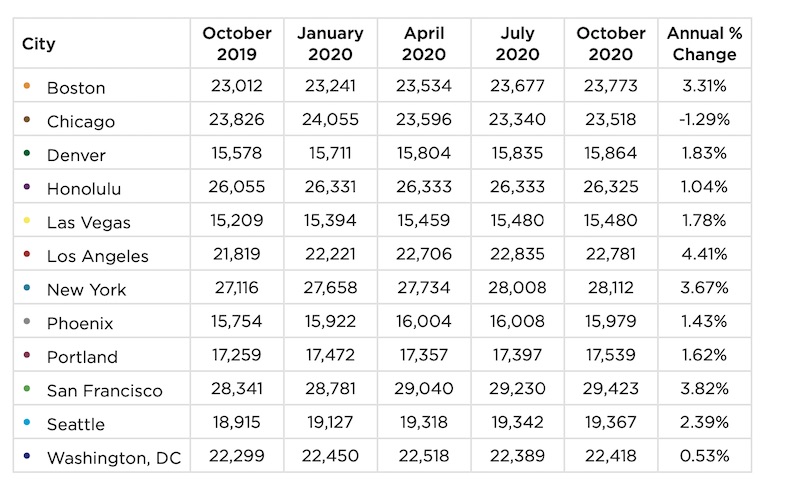
This chart shows the relative costs of materials and labor as bid in markets around the U.S., and the average percentage change from October 2019 to October 2020.
San Francisco and Los Angeles had the highest indices for the Industrial sector, Sn Francisco and Seattle for multifamily costs, and Honolulu and New York for costs attendant to building high schools.
All told, Chicago, Boston, New York, Portland, and San Francisco all experienced cost increases that were higher than the national average in the latest quarter, even though Chicago’s Cost Index was lower, by 1.29%, for the year. Conversely, Los Angeles experienced the highest October 2019-October 2020 increase in its Cost Index, 4.41%, despite a slight decline in the latest quarter. And for the year, San Francisco had the highest “as bid” index measuring a representative sampling of materials and labor among the markets tracked.
Denver, Seattle, and Washington D.C. saw quarterly increases that were below the national average for construction costs.
Related Stories

Market Data | Oct 2, 2019
Spending on nonresidential construction takes a step back in August
Office, healthcare, and public safety are among the fastest-growing sectors, according to the U.S. Census Bureau's latest report.

Market Data | Sep 27, 2019
The global hotel construction pipeline ascends to new record highs
With the exception of Latin America, all regions of the globe either continued to set record high pipeline counts or have already settled into topping-out formations amidst concerns of a worldwide economic slowdown.
Market Data | Sep 25, 2019
Senate introduces The School Safety Clearinghouse Act
Legislation would create a federally funded and housed informational resource on safer school designs.
Market Data | Sep 18, 2019
Substantial decline in Architecture Billings
August report suggests greatest weakness in design activity in several years.
Market Data | Sep 17, 2019
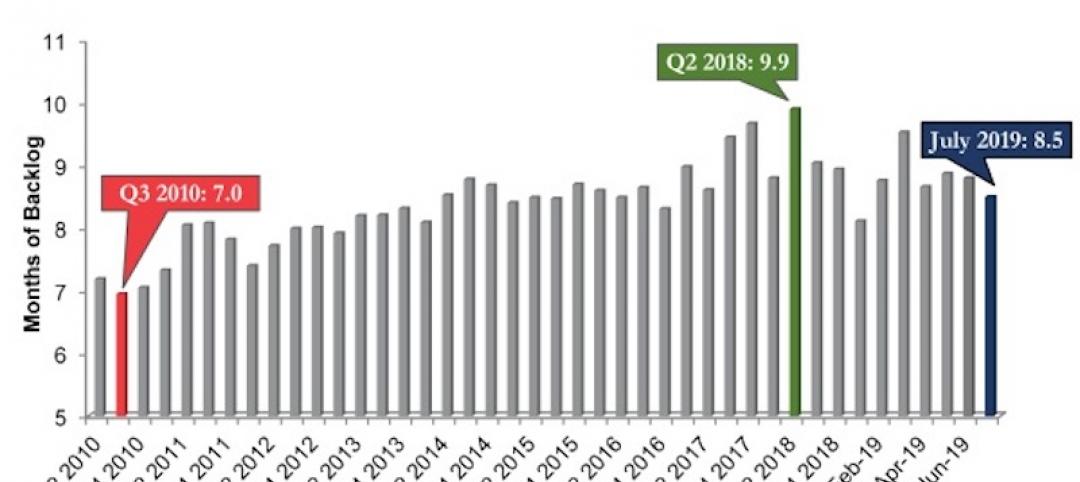
ABC’s Construction Backlog Indicator inches lower in July
Backlog in the heavy industrial category increased by 2.3 months and now stands at its highest level in the history of the CBI series.
Market Data | Sep 13, 2019
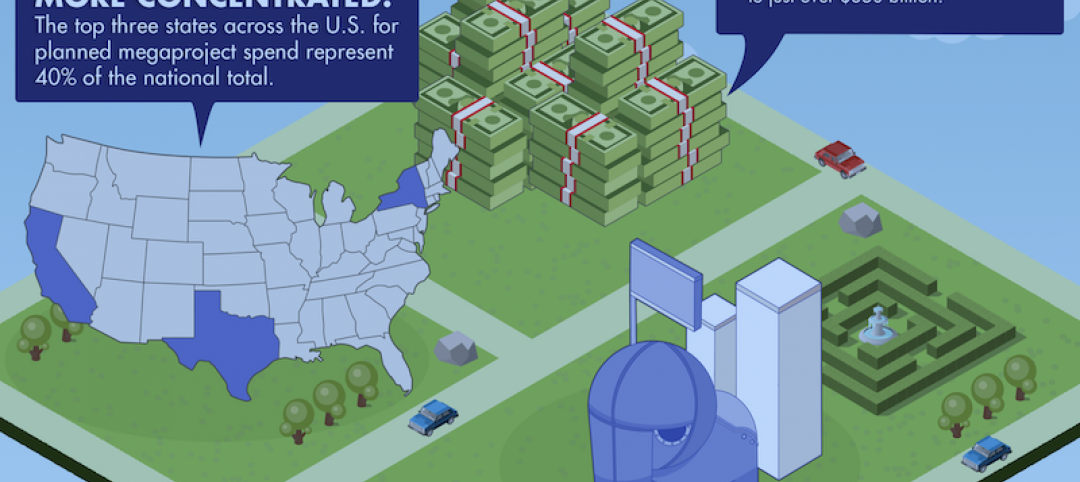
Spending on megaprojects, already on the rise, could spike hard in the coming years
A new FMI report anticipates that megaprojects will account for one-fifth of annual construction spending within the next decade.

Architects | Sep 11, 2019
Buoyed by construction activity, architect compensation continues to see healthy gains
The latest AIA report breaks down its survey data by 44 positions and 28 metros.

Market Data | Sep 11, 2019
New 2030 Commitment report findings emphasize need for climate action
Profession must double down on efforts to meet 2030 targets.

Market Data | Sep 10, 2019
Apartment buildings and their residents contribute $3.4 trillion to the national economy
New data show how different aspects of the apartment industry positively impact national, state and local economies.

Market Data | Sep 3, 2019
Nonresidential construction spending slips in July 2019, but still surpasses $776 billion
Construction spending declined 0.3% in July, totaling $776 billion on a seasonally adjusted annualized basis.


