


In the recent U.S. Construction Pipeline Trend Report released by Lodging Econometrics (LE), at the close the fourth quarter of 2020 and after more than 6 quarters since leading all U.S. markets in the number of pipeline projects, New York City has regained top billing again with 150 projects/25,640 rooms. Other U.S. markets that follow are Los Angeles with 148 projects/24,808 rooms; Dallas with 147 projects/17,756 rooms; Atlanta with 140 projects/19,863 rooms, recording a record-high number of rooms; and Orlando with 112 projects/19,764 rooms, a record-high pipeline project count for the market.
New York City has the greatest number of projects under construction with 108 projects/19,439 rooms and also the highest number of construction starts in the fourth quarter with 14 projects/2,617 rooms. Following New York City with the highest number of projects under construction is Atlanta with 46 projects/6,728 rooms, and then Los Angeles with 40 projects/7,131 rooms; Dallas with 39 projects/4,656 rooms; and Austin with 33 projects/4,850 rooms.
Despite the impact COVID-19 has had on hotel development, there are four markets in the U.S. that announced more than 10 new construction projects in Q4 ’20. Those markets include Miami with 18 projects accounting for 2,756 rooms, Orlando with 18 projects/4,806 rooms, New York with 17 projects/2,700 rooms, and Atlanta with 11 projects/1,843 rooms.
LE has also seen an increase in announced renovation and brand conversion activity throughout the last few quarters. At year-end 2020, there were 1,308 projects/210,124 rooms in the U.S. undergoing a renovation or conversion. Of the 1,308 renovation and conversion projects, 625 of those are in the top 50 markets. There are nine markets in the U.S. that currently have more than 20 renovation and conversion projects underway. That is led by Los Angeles with 28 projects, followed by Phoenix, Washington DC, Houston, Atlanta, Dallas, Chicago, New York, and Norfolk.
The top 50 markets saw 399 hotels/52,581 rooms open in 2020. LE is forecasting these same 50 markets to open another 509 projects/66,475 rooms in 2021, and 575 projects/71,025 rooms in 2022.
Related Stories
Market Data | Jul 18, 2019
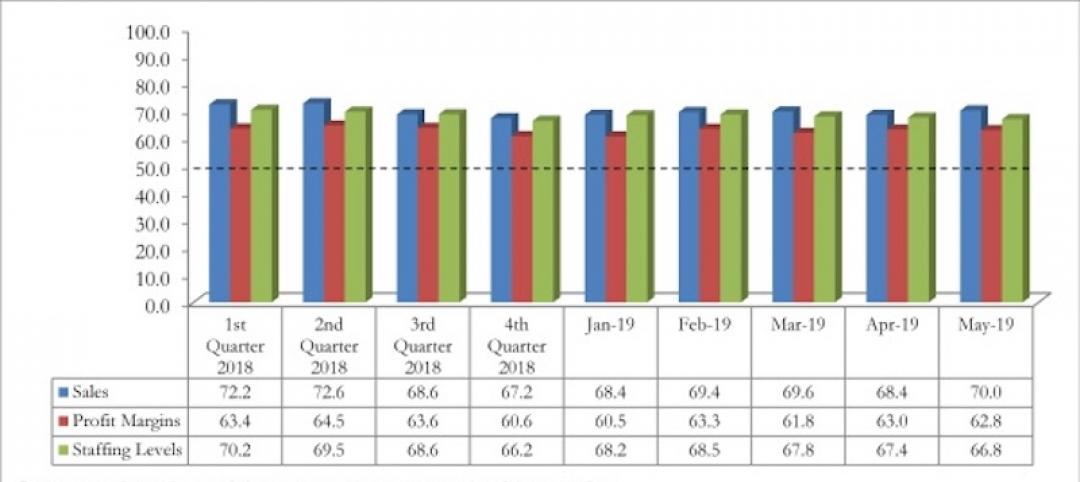
Construction contractors remain confident as summer begins
Contractors were slightly less upbeat regarding profit margins and staffing levels compared to April.
Market Data | Jul 17, 2019
Design services demand stalled in June
Project inquiry gains hit a 10-year low.
Market Data | Jul 16, 2019
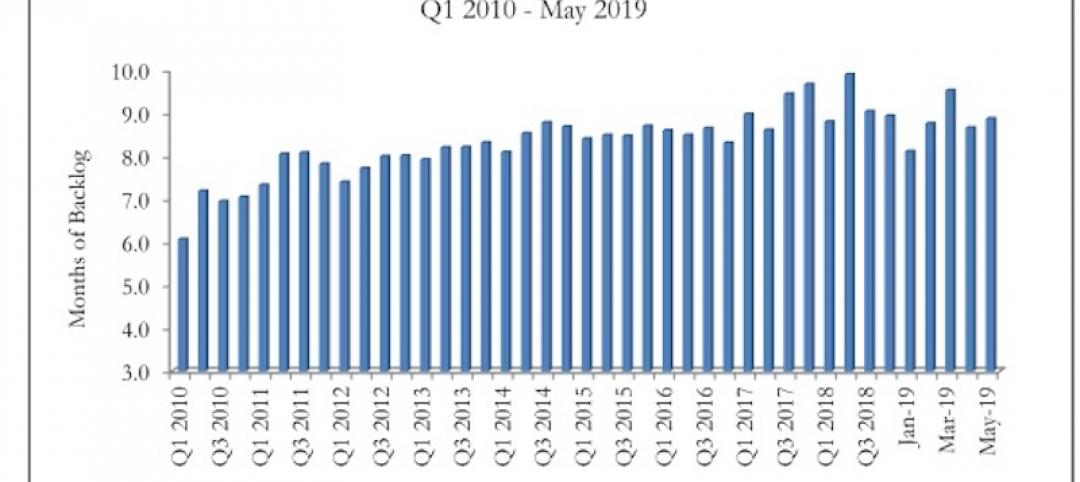
ABC’s Construction Backlog Indicator increases modestly in May
The Construction Backlog Indicator expanded to 8.9 months in May 2019.

K-12 Schools | Jul 15, 2019
Summer assignments: 2019 K-12 school construction costs
Using RSMeans data from Gordian, here are the most recent costs per square foot for K-12 school buildings in 10 cities across the U.S.
Market Data | Jul 12, 2019
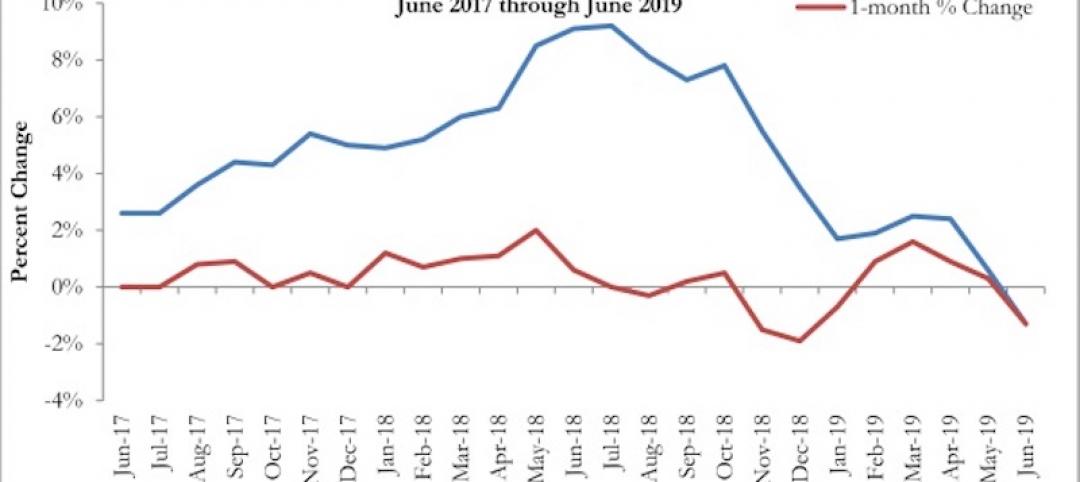
Construction input prices plummet in June
This is the first time in nearly three years that input prices have fallen on a year-over-year basis.
Market Data | Jul 1, 2019
Nonresidential construction spending slips modestly in May
Among the 16 nonresidential construction spending categories tracked by the Census Bureau, five experienced increases in monthly spending.

Market Data | Jul 1, 2019
Almost 60% of the U.S. construction project pipeline value is concentrated in 10 major states
With a total of 1,302 projects worth $524.6 billion, California has both the largest number and value of projects in the U.S. construction project pipeline.

Market Data | Jun 21, 2019
Architecture billings remain flat
AIA’s Architecture Billings Index (ABI) score for May showed a small increase in design services at 50.2.

Market Data | Jun 19, 2019
Number of U.S. architects continues to rise
New data from NCARB reveals that the number of architects continues to increase.
Market Data | Jun 12, 2019
Construction input prices see slight increase in May
Among the 11 subcategories, six saw prices fall last month, with the largest decreases in natural gas.


