

After dipping in the previous two quarters to levels unseen in nearly a decade, the Multifamily-for-Rent outlook for design and construction firms returned to pre-COVID levels in the 3rd Quarter, according to the PSMJ Resources’ Quarterly Market Forecast (QMF). The market’s net plus/minus index (NPMI) reached 40% for the 3rd Quarter, following quarters of -2% and +7%, respectively, in the first half of 2020. The negative index in the 1st Quarter was the first for the Multifamily market since 2010.
"The entire Housing market is showing impressive growth potential based on A/E proposal activity,” said PSMJ Senior Principal David Burstein, PE, AECPM. “This view is reinforced by government statistics for housing permits and new home starts. Multifamily housing (apartment buildings) took a brief pause from its 10-year growth surge when the COVID-19 crisis first hit in March, but has since recovered quite nicely. The condominium market actually saw a significant dip this spring, but more recently is showing signs of recovery, albeit not to the same levels as Multifamily-for-Rent.”
PSMJ’s NPMI expresses the difference between the percentage of firms reporting an increase in proposal activity and those reporting a decrease. The QMF has proven to be a solid predictor of market health for the architecture and engineering (A/E) industry since its inception in 2003. A consistent group of over 300 A/E firm leaders participate regularly, with 162 contributing to the most recent survey.
Multifamily-for-Rent Market Proposal Activity – 1Q08 to 3Q20 (NPMI)
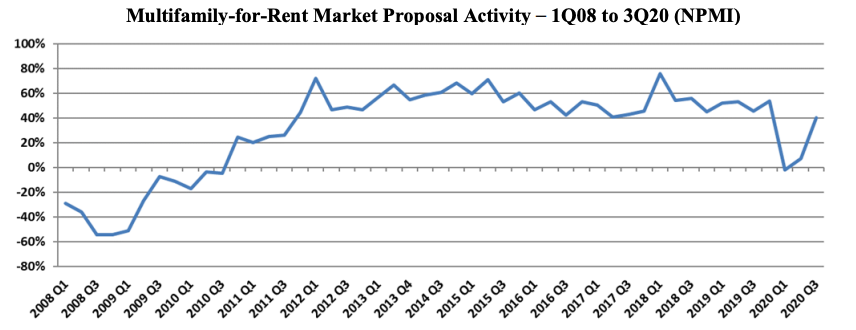
The Multifamily market returned to positive territory out of the Great Recession in the 4th Quarter of 2010 with an NPMI of 24%, then jumped to 44% in the 4th Quarter of 2011. It never dropped below 41% again until it plummeted from 54% in the 4th Quarter of 2019 to -2% in the 1st Quarter of 2020.
“Many of the factors that drove Multifamily's growth pre-COVID remain in place,” adds Burstein. “Plus, there is now a new factor – the potential flight of many people from cities to suburbs – which is shifting the location of the demand. So we believe the Multifamily market will continue to be strong into the foreseeable future.”
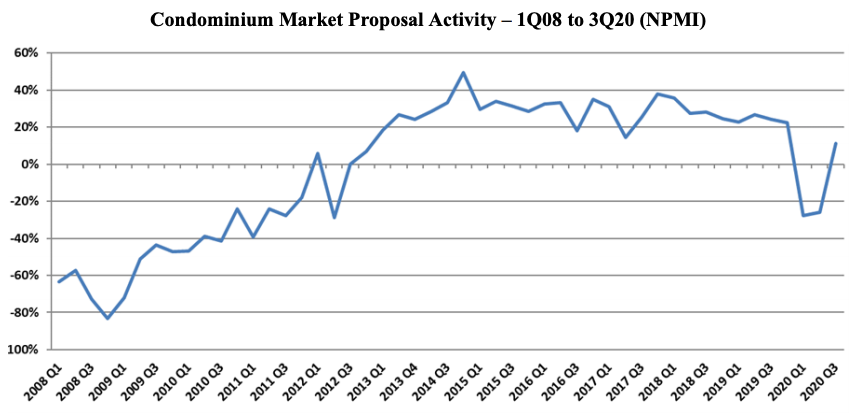
Condominium proposal activity soared to a positive NPMI of 11% in the 3rd Quarter, up from -26% in the 2nd Quarter. The Condo market took longer to recover from the last recession than Multifamily-for-Rent did, not rebounding to positive numbers until late 2012. Its NPMI generally stayed in the 20% and 30% range for the next seven years running, until plummeting from 22% in the 4th Quarter of 2019 to a nine-year low of -28% in the 1st Quarter of 2020.
Condominium Market Proposal Activity – 1Q08 to 3Q20 (NPMI)
The Multifamily rebound was part of overall improving conditions for the Housing market, which paced all 12 of the major markets assessed in the QMF with an overall NPMI of 38%. Among other Housing submarkets, Single-Family Property (individual houses) also recorded a 40% NPMI (up from 9%), with Single-Family Development (Subdivisions) at 27%, up from -12%, and Senior & Assisted Living (Independent Living) at 26%, up from -1%,.
Among the 12 major markets surveyed, Water/Wastewater was a close second to Housing at 37%, followed by Healthcare (30%), Energy/Utilities (28%) and Light Industry (27%). Overall proposal activity across all markets and submarkets returned to growth mode in the 3rd Quarter with an NPMI of 22%, up from -10% in the 2nd Quarter. The three worst-performing major markets in the 3rd Quarter were Education (-36%), Commercial Users (-31%) and Commercial Developers (-21%).
PSMJ Resources, a consulting and publishing company dedicated to the A/E industry, has conducted its Quarterly Market Forecast for more than 17 years. It includes data on 12 major markets and 58 submarkets served by A/E firms. For more information, go to https://www.psmj.com/surveys/quarterly-market-forecast-2.
Related Stories

Building Team | Jun 17, 2022
Data analytics in design and construction: from confusion to clarity and the data-driven future
Data helps virtual design and construction (VDC) teams predict project risks and navigate change, which is especially vital in today’s fluctuating construction environment.

Market Data | Jun 15, 2022
ABC’s construction backlog rises in May; contractor confidence falters
Associated Builders and Contractors reports today that its Construction Backlog Indicator increased to nine months in May from 8.8 months in April, according to an ABC member survey conducted May 17 to June 3. The reading is up one month from May 2021.

Market Data | May 18, 2022
Architecture Billings Index moderates slightly, remains strong
For the fifteenth consecutive month architecture firms reported increasing demand for design services in April, according to a new report today from The American Institute of Architects (AIA).

Market Data | May 12, 2022
Monthly construction input prices increase in April
Construction input prices increased 0.8% in April compared to the previous month, according to an Associated Builders and Contractors analysis of U.S. Bureau of Labor Statistics’ Producer Price Index data released today.

Market Data | May 10, 2022
Hybrid work could result in 20% less demand for office space
Global office demand could drop by between 10% and 20% as companies continue to develop policies around hybrid work arrangements, a Barclays analyst recently stated on CNBC.

Market Data | May 6, 2022
Nonresidential construction spending down 1% in March
National nonresidential construction spending was down 0.8% in March, according to an Associated Builders and Contractors analysis of data published today by the U.S. Census Bureau.
Market Data | Apr 29, 2022
Global forces push construction prices higher
Consigli’s latest forecast predicts high single-digit increases for this year.

Market Data | Apr 29, 2022
U.S. economy contracts, investment in structures down, says ABC
The U.S. economy contracted at a 1.4% annualized rate during the first quarter of 2022.

Market Data | Apr 20, 2022
Pace of demand for design services rapidly accelerates
Demand for design services in March expanded sharply from February according to a new report today from The American Institute of Architects (AIA).

Market Data | Apr 14, 2022
FMI 2022 construction spending forecast: 7% growth despite economic turmoil
Growth will be offset by inflation, supply chain snarls, a shortage of workers, project delays, and economic turmoil caused by international events such as the Russia-Ukraine war.


