

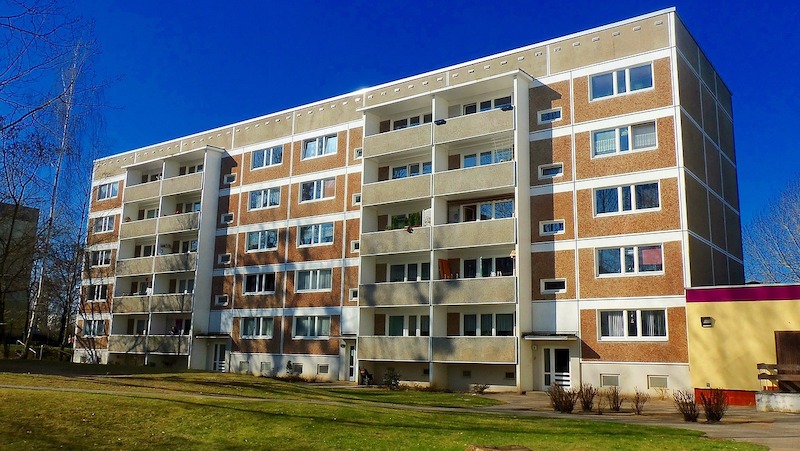
United States multifamily rents continued their impressive performance with a 3.4% year-over-year increase in July 2019, according to a new report from Yardi® Matrix.
Leading gainers included fast-growing Southwest and South metros Las Vegas, Phoenix, Charlotte and Raleigh, N.C., Atlanta and Nashville, Tenn. Rent growth was also strong in areas with concentrations of technology industries such as Boston, Seattle and Portland, Ore.
Even as multifamily fundamentals remain healthy almost everywhere, questions about the overall economy represent “potential for market volatility and slower growth,” the report says.
The average U.S. multifamily rent rose $3 in July, reaching $1,469. Sacramento, Calif., and Austin, Texas, joined Las Vegas, Phoenix and Charlotte as the month’s year-over-year growth leaders. Annual rent growth has topped 3% on a year-over-year basis for each of the past 13 months.
Read more in the Yardi Matrix multifamily national report for July 2019, which is available for download.
Yardi Matrix offers the industry’s most comprehensive market intelligence tool for investment professionals, equity investors, lenders and property managers who underwrite and manage investments in commercial real estate. Yardi Matrix covers multifamily, industrial, office and self storage property types. Email matrix@yardi.com, call 480-663-1149 or visit yardimatrix.com to learn more.
Related Stories

Market Data | Mar 22, 2017
Architecture Billings Index rebounds into positive territory
Business conditions projected to solidify moving into the spring and summer.

Market Data | Mar 15, 2017
ABC's Construction Backlog Indicator fell to end 2016
Contractors in each segment surveyed all saw lower backlog during the fourth quarter, with firms in the heavy industrial segment experiencing the largest drop.

Market Data | Feb 28, 2017
Leopardo’s 2017 Construction Economics Report shows year-over-year construction spending increase of 4.2%
The pace of growth was slower than in 2015, however.

Market Data | Feb 23, 2017
Entering 2017, architecture billings slip modestly
Despite minor slowdown in overall billings, commercial/ industrial and institutional sectors post strongest gains in over 12 months.

Market Data | Feb 16, 2017
How does your hospital stack up? Grumman/Butkus Associates 2016 Hospital Benchmarking Survey
Report examines electricity, fossil fuel, water/sewer, and carbon footprint.

Market Data | Feb 1, 2017
Nonresidential spending falters slightly to end 2016
Nonresidential spending decreased from $713.1 billion in November to $708.2 billion in December.

Market Data | Jan 31, 2017
AIA foresees nonres building spending increasing, but at a slower pace than in 2016
Expects another double-digit growth year for office construction, but a more modest uptick for health-related building.
High-rise Construction | Jan 23, 2017
Growth spurt: A record-breaking 128 buildings of 200 meters or taller were completed in 2016
This marks the third consecutive record-breaking year for building completions over 200 meters.

Market Data | Jan 18, 2017
Fraud and risk incidents on the rise for construction, engineering, and infrastructure businesses
Seven of the 10 executives in the sector surveyed in the report said their company fell victim to fraud in the past year.

Market Data | Jan 18, 2017
Architecture Billings Index ends year on positive note
Architecture firms close 2016 with the strongest performance of the year.


