

Hospital construction costs for 2024
Data from Gordian breaks down the average cost per square foot for a three-story hospital across 10 U.S. cities.
HORIZONTV FEATURING BD+C: WATCH EPISODES ON DEMAND AT HORIZONTV
Data from Gordian breaks down the average cost per square foot for a three-story hospital across 10 U.S. cities.
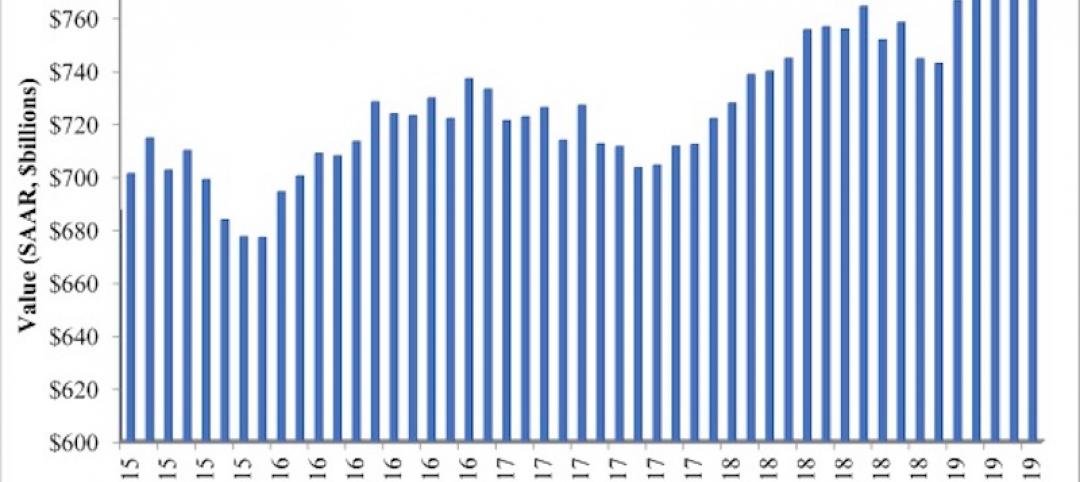
National nonresidential construction spending increased 0.2% in March, according to an Associated Builders and Contractors analysis of data published today by the U.S. Census Bureau. On a seasonally adjusted annualized basis, nonresidential spending totaled $1.19 trillion.
Managers of companies in the industrial sector, including construction, have bought the hype of artificial intelligence (AI) as a transformative technology, but their organizations are not ready to realize its promise, according to research from IFS, a global cloud enterprise software company. An IFS survey of 1,700 senior decision-makers found that 84% of executives anticipate massive organizational benefits from AI.
As seen in the Q1 2024 U.S. Hotel Construction Pipeline Trend Report from Lodging Econometrics (LE), at the end of the first quarter, there are 6,065 projects with 702,990 rooms in the pipeline. This new all-time high represents a 9% year-over-year (YOY) increase in projects and a 7% YOY increase in rooms compared to last year.
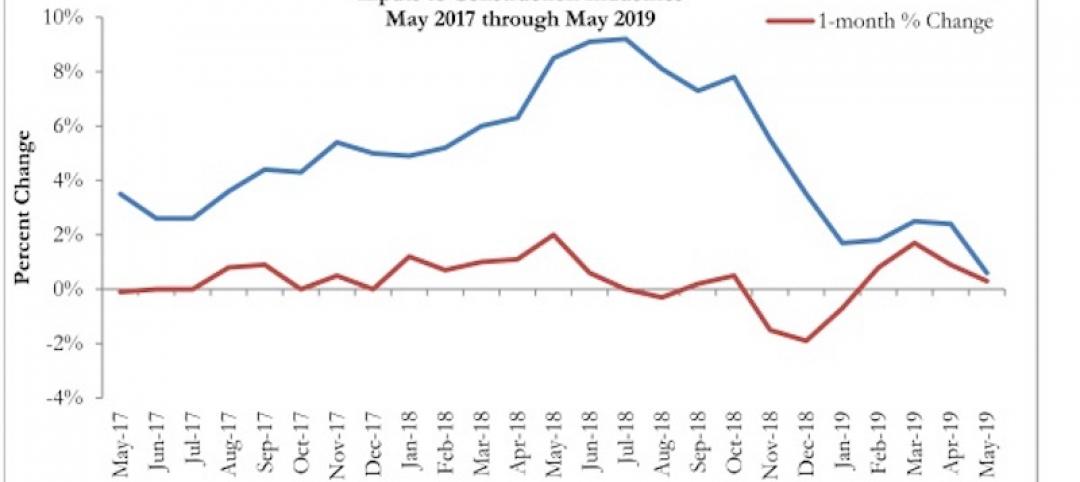
Project inquiry gains hit a 10-year low.
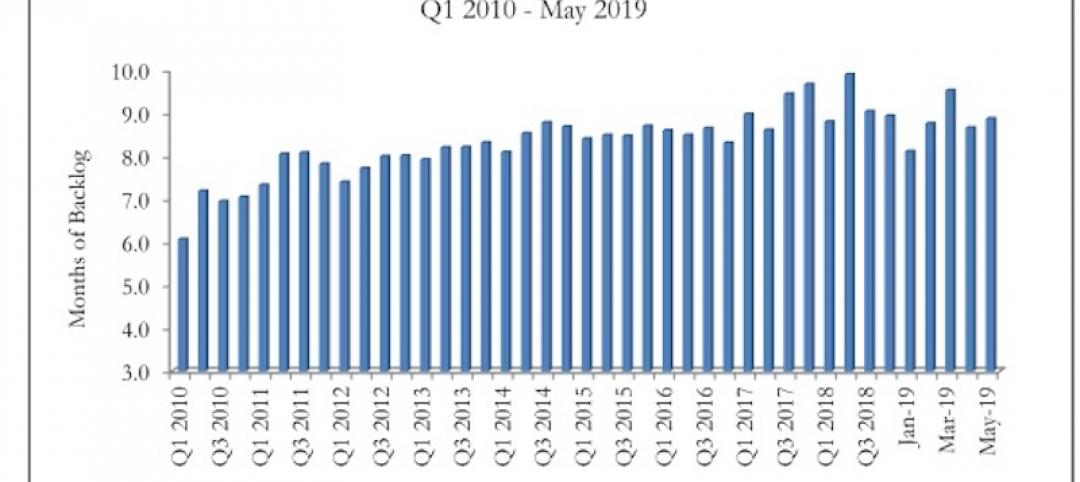
The Construction Backlog Indicator expanded to 8.9 months in May 2019.

Using RSMeans data from Gordian, here are the most recent costs per square foot for K-12 school buildings in 10 cities across the U.S.
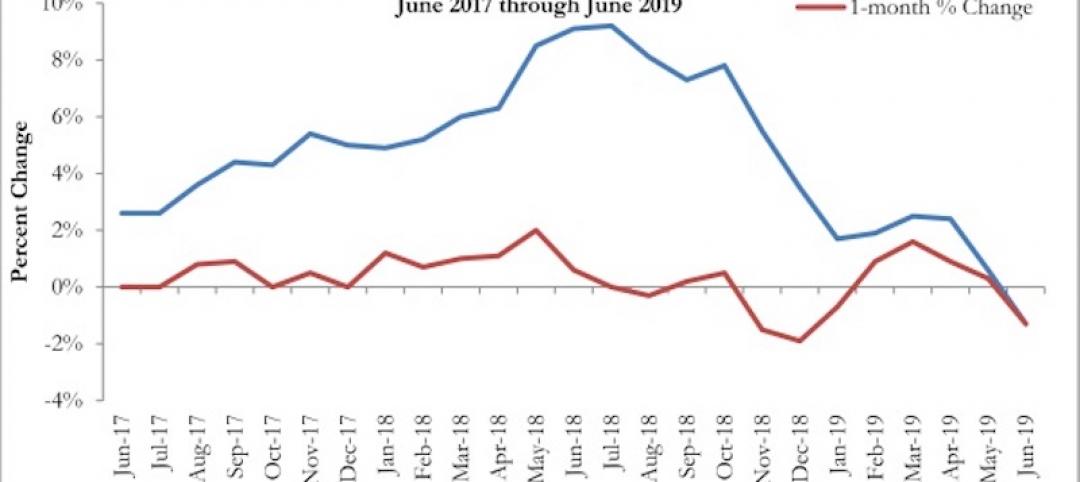
This is the first time in nearly three years that input prices have fallen on a year-over-year basis.
Among the 16 nonresidential construction spending categories tracked by the Census Bureau, five experienced increases in monthly spending.

With a total of 1,302 projects worth $524.6 billion, California has both the largest number and value of projects in the U.S. construction project pipeline.
AIA’s Architecture Billings Index (ABI) score for May showed a small increase in design services at 50.2.

New data from NCARB reveals that the number of architects continues to increase.
Among the 11 subcategories, six saw prices fall last month, with the largest decreases in natural gas.

Among the 16 sectors tracked by the U.S. Census Bureau, nine experienced an increase in monthly spending, led by water supply and highway and street.


