

Grumman/Butkus Associates, a firm of energy efficiency consultants and sustainable design engineers, recently released the results of its 2016 Hospital Energy and Water Benchmarking Survey, focusing on healthcare facilities’ resource usage trends and costs for calendar year 2015.
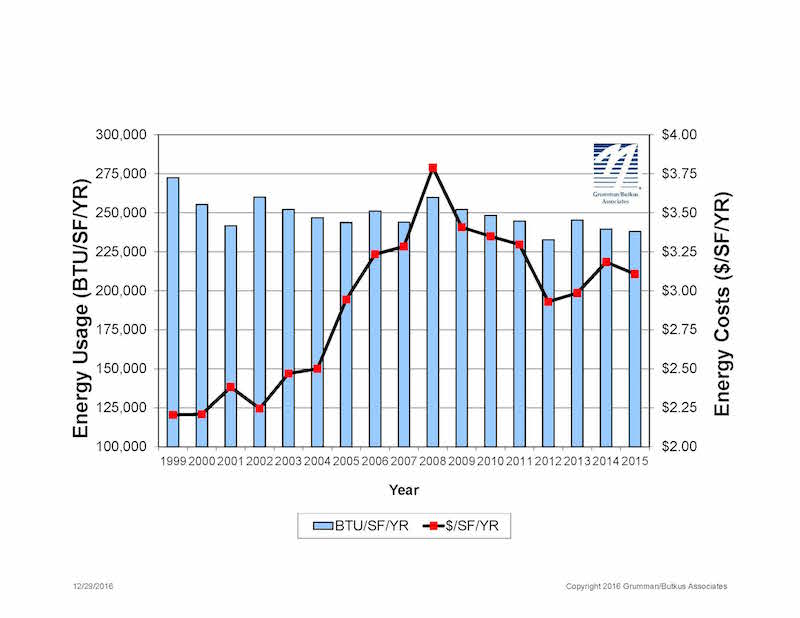
Since G/BA initiated the survey more than 20 years ago, hospitals’ overall fossil fuel use has trended downward, but electricity use isn’t declining as much. The average combined Btu/ft2 (electricity plus gas/steam) for participating facilities was 237,998 in CY2015, slightly down from 239,591 in CY2014.
Square-foot prices for gas/steam were down significantly year-to-year ($0.82 in 2015, compared with $1.02 in 2014), but square-foot prices for electricity rose ($2.28 in 2015, vs. $2.16 in 2014). The overall result is that hospitals’ total ft2 costs for energy (gas/steam plus electric) declined: $3.11 for 2015, compared with $3.18 for 2014.
Hospitals’ average carbon footprint has remained fairly steady at about 60 pounds of CO2 equivalent per ft2 per year since G/BA began calculating carbon data in 1999. “If we are going to address the very daunting issue of climate change, the healthcare industry must make greater strides in reducing its carbon footprint,” says Dan Doyle, G/BA Chairman. “As the trend data shows, not enough progress is being made so far.”
Participating facilities displayed a broad range of usage patterns. For instance, some participants are using more than 200,000 BTU/ft2 in fossil fuel annually, compared with a general mid-range of facilities (about 130,000 BTU/ft2/year) and those that used least (75,000 BTU/ft2/year or less). Similarly, a few hospitals consume more than 40 kWh/ft2/year in electricity, compared with a mid-range of about 25 kWh/ft2/year. A few squeaked by with less than 18 kWh/ft2.
“Facilities that have high unit costs for energy should view this as an opportunity,” says Doyle. “For example, an energy conservation project that would have a five-year payback at an ‘average’ facility may have a payback of just 2.5 or 3 years at a facility with higher unit costs for energy.”
Hospital water/sewer use is also gradually declining, currently averaging about 45 gallons per square foot per year (compared with nearly 70 gallons/ ft2/year a decade ago). Costs for water/sewer are rising, however, now averaging $0.39/ft2. As recently as 2007, hospitals were paying about $0.27/ft2. “G/BA expects the trend of rising water and sewer costs to continue,” says Doyle. “Price hikes not only reflect increasing costs to extract and treat the water, but also the fact that cash-strapped governmental entities may view water as a revenue source.”
Since 1995, the G/BA survey has provided a free annual benchmarking resource. Hospitals are invited to participate by submitting responses to a short list of questions. Information for this edition was provided by 137 hospitals located in Illinois (56), Wisconsin (31), Michigan (29), Indiana (10), and six other states.
Full results and analysis, as well as information about participating in the 2017 survey (2016 data), are available at the firm’s website: grummanbutkus.com/HES. For additional information, contact Dan Doyle (ddoyle@grummanbutkus.com) or Julie Higginbotham (jhigginbotham@grummanbutkus.c
Related Stories

Giants 400 | Sep 20, 2023
Top 80 Hospitality Facility Construction Firms for 2023
Suffolk Construction, The Yates Companies, STO Building Group, and PCL Construction Enterprises top BD+C's ranking of the nation's largest hospitality facilities sector contractors and construction management (CM) firms for 2023, as reported in Building Design+Construction's 2023 Giants 400 Report. Note: This ranking includes revenue for all hospitality facilities work, including casinos, hotels, and resorts.

Giants 400 | Sep 20, 2023
Top 75 Hospitality Facility Engineering Firms for 2023
Jacobs, IMEG, EXP, and Tetra Tech top BD+C's ranking of the nation's largest hospitality facilities sector engineering and engineering/architecture (EA) firms for 2023, as reported in Building Design+Construction's 2023 Giants 400 Report. Note: This ranking includes revenue for all hospitality facilities work, including casinos, hotels, and resorts.

Giants 400 | Sep 20, 2023
Top 130 Hospitality Facility Architecture Firms for 2023
Gensler, WATG, HKS, and JCJ Architecture top BD+C's ranking of the nation's largest hospitality facilities sector architecture and architecture/engineering (AE) firms for 2023, as reported in Building Design+Construction's 2023 Giants 400 Report. Note: This ranking includes revenue for all hospitality facilities work, including casinos, hotels, and resorts.

Mixed-Use | Sep 20, 2023
Tampa Bay Rays, Hines finalize deal for a stadium-anchored multiuse district in St. Petersburg, Fla.
The Tampa Bay Rays Major League Baseball team announced that it has reached an agreement with St. Petersburg and Pinellas County on a $6.5 billion, 86-acre mixed-use development that will include a new 30,000-seat ballpark and an array of office, housing, hotel, retail, and restaurant space totaling 8 million sf.

Hotel Facilities | Sep 15, 2023
The next phase of sustainability in luxury hotels
The luxury hotel market has seen an increase in green-minded guests looking for opportunities to support businesses that are conscientious of the environment.

Giants 400 | Aug 22, 2023
Top 115 Architecture Engineering Firms for 2023
Stantec, HDR, Page, HOK, and Arcadis North America top the rankings of the nation's largest architecture engineering (AE) firms for nonresidential building and multifamily housing work, as reported in Building Design+Construction's 2023 Giants 400 Report.

Giants 400 | Aug 22, 2023
2023 Giants 400 Report: Ranking the nation's largest architecture, engineering, and construction firms
A record 552 AEC firms submitted data for BD+C's 2023 Giants 400 Report. The final report includes 137 rankings across 25 building sectors and specialty categories.

Giants 400 | Aug 22, 2023
Top 175 Architecture Firms for 2023
Gensler, HKS, Perkins&Will, Corgan, and Perkins Eastman top the rankings of the nation's largest architecture firms for nonresidential building and multifamily housing work, as reported in Building Design+Construction's 2023 Giants 400 Report.

Sustainability | Aug 15, 2023
Carbon management platform offers free carbon emissions assessment for NYC buildings
nZero, developer of a real-time carbon accounting and management platform, is offering free carbon emissions assessments for buildings in New York City. The offer is intended to help building owners prepare for the city’s upcoming Local Law 97 reporting requirements and compliance. This law will soon assess monetary fines for buildings with emissions that are in non-compliance.

Hotel Facilities | Aug 2, 2023
Top 5 markets for hotel construction
According to the United States Construction Pipeline Trend Report by Lodging Econometrics (LE) for Q2 2023, the five markets with the largest hotel construction pipelines are Dallas with a record-high 184 projects/21,501 rooms, Atlanta with 141 projects/17,993 rooms, Phoenix with 119 projects/16,107 rooms, Nashville with 116 projects/15,346 rooms, and Los Angeles with 112 projects/17,797 rooms.


