

Access to data has proliferated over the past decade, with terms like “big data,” “open access,” and “hackathons” heralding a new era where decisions can be made more quickly and accurately based on empirical evidence that was not available in the past. In 2013, then President Obama signed an executive order directing federal agencies to make the data they generate “easy to find, accessible, and usable.”
While the Trump Administration is curtailing this effort at the federal level, at least 128 cities in the U.S., every state, and the District of Columbia have made some amount of data openly available to the public. The sidebar at the end of this article shares examples of open data sets that can be used to inform design projects in many areas of the country.
More and more, green building teams are relying on these types of external metrics to prioritize green building design decisions. Chris Pyke, former Director of Research at the U.S. Green Building Council and current Chief Strategy Officer at Aclima, sees enormous potential in “a new generation of tools that focus on the design process, establish clear expectations for operational performance, and connect directly to measurable outcomes. This focus directly attacks the two greatest weaknesses—in my opinion—of prevailing green building practice: inadequate design and planning processes and the absence of explicit feedback loops between design and operations.”
A glance at the Greenbuild 2017 presentation roster offers a snapshot of the role that contextual environmental and health data are beginning to play in the green building design process.
Greenbuild 2017 Sessions Incorporating Contextual Data
A11 - Getting Smart About Sustainable Cities
Wednesday, Nov 8: 2pm-3pm
Kari Hewitt, Steven Anderson, Chris Castro, Nigel Jacob
C06 - Are America's Great Highways Killing Us: The Community View
Thursday, Nov 9: 8am-10am
Lydia Lowe, Betsy del Monte, James Newman
E10 - Greening Existing Neighborhoods with LEED-ND & EcoDistricts
Thursday, Nov 9: 3pm-4pm
Neil Angus, David Queeley, Tiffany Cogell, Irena Stojkov
F11 - How Real-time Energy Visualization Can Inform City Design
Thursday, Nov 9: 5pm-6pm
Calum Thompson, Avinash Srivastava, Justin Shultz
G09 - Renewable Heating and Cooling - The Missing Link
Friday, Nov 10: 8am-9am
James Leahy, Benjamin Silverman, Kendra Tupper, Neil Veilleux
H13 - Rapid Resilience Assessments for Multifamily Buildings
Friday, Nov 10: 9:30am-10:30am
Laurie Schoeman, Thomas Chase
Why Use Nontraditional Data sets?
Given the complexity, budgetary constraints, and scheduling pressures of the real estate development process, incorporating yet another set of criteria (complete with new consultants and their fees) into a project can seem a daunting task. However, as the Greenbuild sessions described below demonstrate, data sets that give a more complete understanding of context are in demand, for at least three reasons: they provide a bird’s eye view for decision makers; they help spur market transformation; and, they fill identified gaps in knowledge.
Bird’s Eye View
As design and modeling software continue to improve in accuracy, agility, and ease of use, it has become easier to understand what is really happening on the ground at a facility. In part, this is due to the increasing affordability of movable sensors and information-gathering smart phone apps. As Steven Anderson, Director of Applied Technologies at VHB explains, “When we talk about sustainability, we are usually looking back to compare this year with other years. But, today, we can look at data on a specific day and time. So, for example, if we are using more water today than we have used on this date in previous years, a smart meter can tell us that there is a leak. And, we can go find and fix it before it becomes a break.”
Imagine the possibility if that scenario were carried out simultaneously for multiple building systems at once. Until recently, models generally focused on one question at a time: e.g., water demand, wastewater generation, energy efficiency, etc. New dashboards are starting to pull together the disparate strands of information generated by underlying single-variable models to provide decision makers with a menu of expected benefits and costs depending on the selected scenario. Calum Thompson, High Performance Communities Team Lead at AECOM gives an example: “We now have the ability to inform planners and policy makers immediately of the impact of implementing certain energy interventions at the portfolio-level through an interactive user interface.
We extrapolate the financial and energy efficiency gains usage patterns, age, and size to quantify, and then communicate, the investment and expected savings across the city or portfolio. For example, we just completed a study for the New York City Housing Authority where we’ve identified over $65 million in annual utility savings having assessed less than 20% of the portfolio – developing a 3-D map of the buildings to show where projects/savings are, geographically.”
Steven agrees that providing data points that are not typically included in a site study can be illuminating. “For a transportation corridor study, we assembled a number of healthy communities data sets, such as: Are there sidewalks with proper lighting? Are crime rates high, or are there other reasons that might be a barrier to people using the sidewalk? Are there nearby healthy corner stores? We were able to bring that information into the corridor design conversation, so that the final design addressed health concerns in addition to its stated transportation objectives.” Kari Hewitt, Director of Sustainability at VHB expands: “We know as a rule of thumb that putting in cycling and pedestrian infrastructure is good for a community. But, including information about the associated improvements to asthma and obesity rates alongside projected improvements in economic numbers and reduced greenhouse gas emissions gives decision makers the ability to base their investment decisions on the combination of all of these indicators.”
The ultimate goal, say all three, are user-friendly portals that allow decision makers to see an array of possible benefits and costs associated with design or operations decisions. These portals would run the single-issue models in the background, translating their computational analysis into understandable decision points.
Market Transformation
Contextual data is also being used to help cities and states meet environmental goals that would be unattainable without nudging the market. For example, Calum Thompson uses energy master planning to set the infrastructure framework for projects targeting stringent energy efficiency, resiliency, and/or greenhouse gas mitigation goals. Different space types require different infrastructure needs, from energy demand to water and wastewater generation to traffic congestion. He explains, “For a planning project in China, we are evaluating the impact of various combinations of building zoning types (such as residential, retail, office, etc.) and density on city infrastructure demands. Our process quantifies in real-time, using a combination of emerging modeling software and contextual data sets, the resultant demands on infrastructure (water supply, electrical supply, transportation routes, etc.) to support the city in optimizing investment in meeting their environmental goals.”
Fill the Gaps
Finally, designers and decision makers alike are turning to off-site data sets and qualitative assessments to help answer questions that traditional green building tools do not address directly, such as health, equity, and climate change resilience.
The Talbot Norfolk Triangle Eco-Innovation District, located in a historically underserved neighborhood in Boston, MA, has found that prioritizing social equity has led to stepping outside the traditional LEED for Neighborhood Development process in a number of ways. For starters, its host organization, the Codman Square Neighborhood Development Corporation (CSNDC), has flipped the “business as usual” sequence for community engagement on its head at times. David Queeley, Director of Eco-Innovation at CSNDC explains, “On a typical development project, we would hire the designer, come up with some sketches, and then engage the community. This time, the community helped hire the designer, which brought with it better community buy-in and ownership of the project.”
Community engagement has also extended to collaborating closely with neighborhood community organizers like Tiffany Cogell, Block Steward for Active Transit and Healthy Community Champion at The Boston Project Ministries, to help set the agenda for the Eco-District. The result is a mix of interventions to the built environment (e.g., attracting mixed-use Transit-Oriented Development to the site, increasing green space and urban agriculture in the neighborhood, advocating for bike lanes, etc.) that are highly coordinated with neighborhood association initiatives (e.g., walking and cycling groups, slow streets initiative, a community gardening group, etc.).
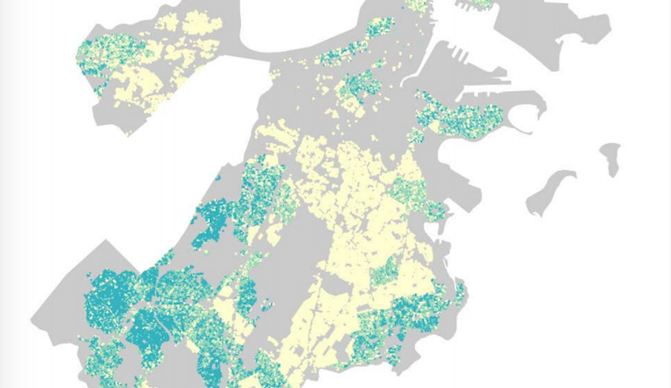
In a different part of Boston, the Community Assessment of Freeway Exposure and Health (CAFEH) project has used non-traditional data sets to fill a different gap. The goal of this multi-year study has been to encourage the use of building and land use design to reduce exposure to ultrafine particles (UFP, defined as particulate matter < 0.1 micrometer (μm) in diameter) among populations located within 1,300 ft of highways. Much smaller than the better known PM10 (10 μm in diameter) and PM2.5 (2.5 μm in diameter) categories of particulate matter, exposure to UFP have been shown to dramatically increase the risk of premature death from heart disease.
The Greenbuild session is designed after a community design charrette held in 2014 to test the efficacy of 11 design strategies that were drawn from a review of public health literature. Jim Newman, Principal at Linnean Solutions, explains: “One thing we learned from the 2014 charrette that we hope to replicate at Greenbuild was that the real value of the charrette was getting key decision makers fully checked into the issue and turning them into spokespeople for the issue within their peer group.” Betsy del Monte, Principal at Transform Global adds, “The research helps people understand that if they are near a highway, they can do things to protect building occupants from particulates through the design and placement of buildings. Design can help mitigate some of the social and environmental equity concerns associated with freeway placement.”
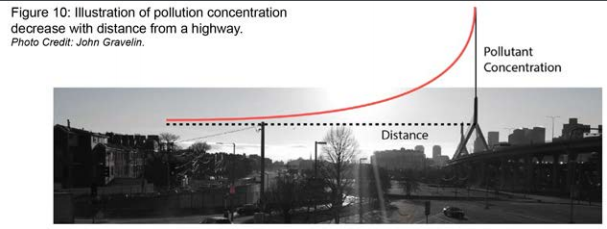 Illustration of pollution concentration decrease with distance from a highway. Credit: John Gravelin, after work by Brugge D, Durant J, Patton A, Newman J, Zamore W.
In a similar vein, the Enterprise Green Communities (EGC) flooding resilience rapid assessment was designed to introduce a topic that may be unfamiliar to many building professionals: climate resilience. This highly accessible, low-tech tool compiles the best research and practice from a decade of work at EGC into an easy-to-use checklist. It allows owners of multifamily housing to rapidly assess vulnerability to flooding and poor indoor air quality and then provides recommendations for actions to reduce risk. Data points range from the location and age of the building’s mechanical system and boiler to an assessment of whether the perimeter space on site could increase pervious surfaces. Laurie Schoeman, National Program Director for Resilient Communities at Enterprise Community Partners explains, “This tool tries to shift the lens of the industry to incorporate climate risk. We did this 12 years ago with green building where we got very conservative investors to incorporate green building in their risk assessments. Resilience is the next stage, and Enterprise Green Communities is bringing that focus to low income communities and vulnerable populations.”
Specifics are Key
While some of the projects in this snapshot from Greenbuild remain at the scale of policy or urban planning, the ones that successfully make the leap to influencing building design have two characteristics in common. 1) They all translate research into specific design recommendations. And, 2) all of them see education and outreach as integral to their project’s success.
Betsy del Monte describes the power of the CAFEH project as “using the strength of the research to make a case that this is compelling enough, proven enough, urgent enough, and easy enough to implement that designers will be convinced to change the way they practice.”
In the absence of multi-year scientific studies such as the CAFEH project, a public health tool called health impact assessment (HIA) can be used to develop evidence-based recommendations for real estate projects. For example, Neil Angus, Environmental Planner at Devens Enterprise Commission, explains that “the educational materials developed for an HIA on the health benefits of street trees in Lawrence, MA, are informing development conversations in other parts of the region, including the Talbot Norfolk Triangle Eco-Innovation District.”
The Next Phase of Evolution
While it can be easy to get lost in the numbers, in the end, the purpose of design is to improve people’s lives. Perhaps that is why so much of the emphasis on contextual data sets focuses on improving health outcomes. As Chris Pyke points out, “we first need to understand the specific needs of people in a place and create built environments to shape their exposures, behaviors, and other health-related factors. Moreover, we should be held accountable not just for the physical measures we put into place, but the human outcomes that result. As part of this shift, we have the opportunity to develop a relentless focus on improving our process to improve measurable, real world outcomes for people.”
Examples of open data sets available for use on design projects
Environmental and Real Estate
Peer City Identification Tool, https://chicagofed.org/region/community-development/data/pcit: Identifies cities experiencing similar trends on topics related to socioeconomics, demographics, and housing.
U.S. City Open Data Census, http://us-city.census.okfn.org: Provides links to city zoning ordinances, property assessments, parcel information, transit systems, construction permits, and property deeds.
U.S. Energy Information Administration (EIA), https://www.eia.gov: Data sets include building energy and water use, CO2 emissions, and information about the electrical grid.
U.S. Geological Survey Land Cover Institute, https://landcover.usgs.gov/landcoverdata.php: Provides access to data sets and tools addressing the current mix of land cover and likely future trends.
U.S. Green Building Council Green Building Information Gateway (GBIG), http://www.gbig.org: A collection of green building projects that allows comparisons across geographies, certification programs, energy benchmarking programs, and more.
World Bank Group CURB Tool, http://www.worldbank.org/en/topic/urbandevelopment/brief/the-curb-tool-climate-action-for-urban-sustainability: Interactive tool using local data sets to help cities prioritize actions to reduce greenhouse gas emissions.
Health and Socioeconomic
500 Cities, https://www.cdc.gov/500cities/: Provides data on chronic disease risk factors, health outcomes, and access to clinical care for the 500 largest cities in the U.S.
Community Commons, https://www.communitycommons.org: Provides access to data and mapping tools for topics ranging from equity, economics, education, environment, food, and health.
County Health Rankings, http://www.countyhealthrankings.org: Ranking based on a combination of metrics quantifying physical environment characteristics, socioeconomic factors, health behaviors, access to clinical care, quality of life, and lifespan.
National Environmental Public Health Tracking Network, https://ephtracking.cdc.gov: Social and environmental determinants of health and health outcomes for chronic disease, climate change, and environmental toxins.
U.S. Census and American Community Survey, http://census.gov: A wide range of demographic and socioeconomic data.
U.S. Global Change Research Program Metadata Access Tool for Climate and Health (MATCH), https://match.globalchange.gov/geoportal/catalog/main/home.page: Descriptions of openly available data sets related to climate change, health, and the environment.
Related Stories
| Jan 7, 2011
Mixed-Use on Steroids
Mixed-use development has been one of the few bright spots in real estate in the last few years. Successful mixed-use projects are almost always located in dense urban or suburban areas, usually close to public transportation. It’s a sign of the times that the residential component tends to be rental rather than for-sale.
| Dec 7, 2010
Blue is the future of green design
Blue design creates places that are not just neutral, but actually add back to the world and is the future of sustainable design and architecture, according to an interview with Paul Eagle, managing director of Perkins+Will, New York; and Janice Barnes, principal at the firm and global discipline leader for planning and strategies.
| Nov 29, 2010
Renovating for Sustainability
Motivated by the prospect of increased property values, reduced utility bills, and an interest in jumping on the sustainability bandwagon, a noted upturn in green building upgrades is helping designers and real estate developers stay busy while waiting for the economy to recover. In fact, many of the larger property management outfits have set up teams to undertake projects seeking LEED for Existing Buildings: Operations & Maintenance (LEED-EBOM, also referred to as LEED-EB), a certification by the U.S. Green Building Council.
| Nov 16, 2010
Brazil Olympics spurring green construction
Brazil's green building industry will expand in the coming years, spurred by construction of low-impact venues being built for the 2016 Olympics. The International Olympic Committee requires arenas built for the 2016 games in Rio de Janeiro meet international standards for low-carbon emissions and energy efficiency. This has boosted local interest in developing real estate with lower environmental impact than existing buildings. The timing couldn’t be better: the Brazilian government is just beginning its long-term infrastructure expansion program.
| Nov 16, 2010
Green building market grows 50% in two years; Green Outlook 2011 report
The U.S. green building market is up 50% from 2008 to 2010—from $42 billion to $55 billion-$71 billion, according to McGraw-Hill Construction's Green Outlook 2011: Green Trends Driving Growth report. Today, a third of all new nonresidential construction is green; in five years, nonresidential green building activity is expected to triple, representing $120 billion to $145 billion in new construction.
| Nov 11, 2010
USGBC certifies more than 1 billion square feet of commercial space
This month, the total footprint of commercial projects certified under the U.S. Green Building Council’s LEED Green Building Rating System surpassed one billion square feet. Another six billion square feet of projects are registered and currently working toward LEED certification around the world. Since 2000, more than 36,000 commercial projects and 38,000 single-family homes have participated in LEED.
| Nov 9, 2010
Turner Construction report: Green buildings still on the agenda
Green buildings continue to be on the agenda for real estate owners, developers, and corporate owner-occupants, according to the Turner 2010 Green Building Market Barometer. Key findings: Almost 90% of respondents said it was extremely or very likely they would incorporate energy-efficiency improvements in their new construction or renovation project, and 60% expected to incorporate improvements to water efficiency, indoor environmental quality, and green materials.

| Nov 2, 2010
11 Tips for Breathing New Life into Old Office Spaces
A slowdown in new construction has firms focusing on office reconstruction and interior renovations. Three experts from Hixson Architecture Engineering Interiors offer 11 tips for office renovation success. Tip #1: Check the landscaping.
| Nov 2, 2010
A Look Back at the Navy’s First LEED Gold
Building Design+Construction takes a retrospective tour of a pace-setting LEED project.


