


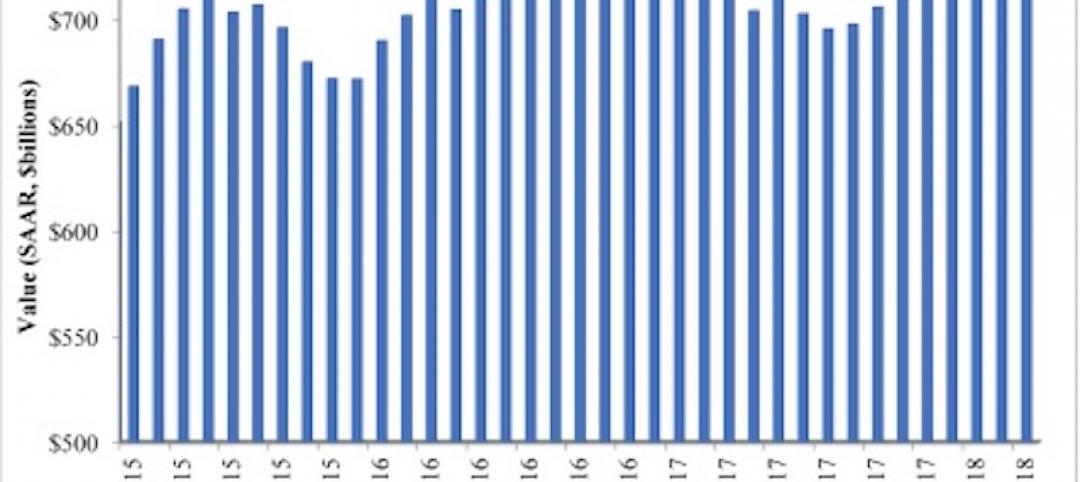
During the first half of 2018, five of the top ten metropolitan markets for commercial and multifamily construction starts ranked by dollar volume showed increased activity compared to a year ago, according to Dodge Data & Analytics. Of the top twenty markets, eleven were able to register gains. At the national level, the volume of commercial and multifamily construction starts during the first half of 2018 was $101.4 billion, down 1% from last year’s first half, although still 2% above what was reported during the first half of 2016.
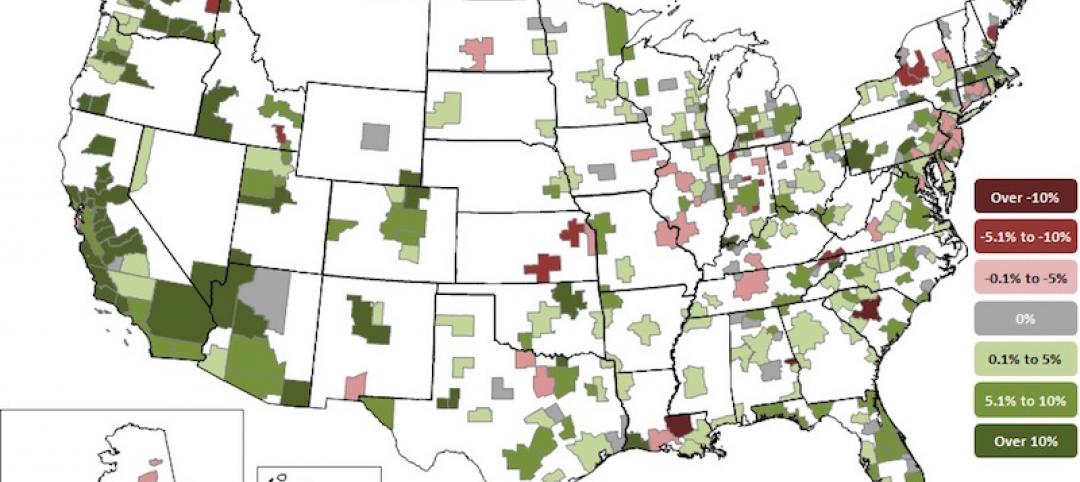
The New York NY metropolitan area, at $16.1 billion during the first half of 2018, held onto its number one ranking and comprised 16% of the U.S. commercial and multifamily total, helped by a 44% jump compared to a year ago. During the previous two years, the New York NY share of the U.S. total had slipped to 14% in 2016 and 13% in 2017, after seeing its share reach a peak at 19% back in 2015. Other markets in the top ten showing growth during the first half of 2018 were Washington DC ($5.0 billion), up 23%; Miami FL ($4.9 billion), up 34%; Boston MA ($3.7 billion), up 56%; and Seattle WA ($3.2 billion), up 7%. Of these markets, the top four (New York, Washington DC, Miami, and Boston) showed renewed growth after the decreased activity reported for the full year 2017, while Seattle was able to maintain the upward track present last year. Metropolitan areas showing decreased activity for commercial and multifamily construction starts during the first half of 2018 were Dallas-Ft. Worth TX ($3.4 billion), down 23%; Los Angeles CA ($2.9 billion), down 38%; San Francisco CA ($2.8 billion), down 38%; Chicago IL ($2.7 billion), down 37%; and Atlanta GA ($2.0 billion), down 43%.
For those markets ranked 11 through 20, the six that registered first half 2018 gains were Austin TX ($1.8 billion), up 15%; Kansas City MO ($1.7 billion), up 52%; Orlando FL ($1.6 billion), up 4%; Phoenix AZ ($1.6 billion), up 19%; Minneapolis-St. Paul MN ($1.3 billion), up 34%; and Portland OR ($1.1 billion), up 15%. The four posting declines were Houston TX ($1.9 billion), down 13%; Philadelphia PA ($1.7 billion), down 13%; Denver CO ($1.6 billion), down 25%; and San Jose CA ($1.1 billion), down 37%.
The commercial and multifamily total is comprised of office buildings, stores, hotels, warehouses, commercial garages, and multifamily housing. At the U.S. level, the 1% drop for the commercial and multifamily total during the first half of 2018 reflected an 8% retreat for commercial building that was essentially balanced by an 8% increase for multifamily housing.

“Multifamily housing has proven to be surprisingly resilient so far during 2018, following its 8% decline in dollar terms at the U.S. level that was reported for the full year 2017,” stated Robert A. Murray, chief economist for Dodge Data & Analytics. “With apartment vacancy rates beginning to edge upward on a year-over-year basis, banks had been taking a more cautious stance towards lending for multifamily projects. Yet, after some loss of momentum during 2017, several factors appear to be providing near-term support for multifamily housing. The U.S. economy is currently moving at a healthy clip, with steady job growth bringing new workers into the labor force. The demand for multifamily housing by millennials remains
strong, given their desire to live in downtown areas while the increasing price of a single family home and diminished tax benefits may be dissuading some from making the transition to single family home ownership. As shown by this year’s surveys of bank lending officers conducted by the Federal Reserve, the extent of bank tightening for multifamily construction loans is not as widespread as a year ago.”
“On a broader level for commercial building, lending standards for nonresidential building loans have eased slightly over the past two quarters,” Murray continued. “And, the rollback of some of the Dodd-Frank restraints on the banking sector may encourage mid-size banks to increase lending for commercial real estate. While the expansion for commercial building and multifamily construction starts has clearly decelerated, the near-term shift appears to be one towards a plateau as opposed to a decline. This is consistent with the recent pattern for commercial and multifamily construction starts by major metropolitan areas, which reveals a fairly equal balance between those markets still showing gains and those markets showing decreased activity.”
Related Stories

Market Data | May 2, 2018
Construction employment increases in 245 metro areas between March 2017 & 2018, as trade fights & infrastructure funding shortfalls loom
Houston-The Woodlands-Sugar Land, Texas and Weirton-Steubenville, W.Va.-Ohio experience largest year-over-year gains; Baton Rouge, La. and Auburn-Opelika, Ala. have biggest annual declines.
Market Data | May 2, 2018
Nonresidential Construction down in March, private sector falters, public sector unchanged
February’s spending estimate was revised roughly $10 billion higher.

Market Data | Apr 30, 2018
Outlook mixed for renewable energy installations in Middle East and Africa region
Several major MEA countries are actively supporting the growth of renewable energy.
Market Data | Apr 12, 2018
Construction costs climb in March as wide range of input costs jump
Association officials urge Trump administration, congress to fund infrastructure adequately as better way to stimulate demand than tariffs that impose steep costs on contractors and project owners.

Market Data | Apr 9, 2018
Construction employers add 228,000 jobs over the year despite dip in March
Average hourly earnings increase to $29.43 in construction, topping private sector by nearly 10%; Association officials urge updating and better funding programs to train workers for construction jobs.
Market Data | Apr 4, 2018
Construction employment increases in 257 metro areas between February 2017 & 2018 as construction firms continue to expand amid strong demand
Riverside-San Bernardino-Ontario, Calif. and Merced, Calif. experience largest year-over-year gains; Baton Rouge, La. and Auburn-Opelika, Ala. have biggest annual declines in construction employment.

Market Data | Apr 2, 2018
Construction spending in February inches up from January
Association officials urge federal, state and local officials to work quickly to put recently enacted funding increases to work to improve aging and over-burdened infrastructure, offset public-sector spending drops.

Market Data | Mar 29, 2018
AIA and the University of Minnesota partner to develop Guides for Equitable Practice
The Guides for Equitable Practice will be developed and implemented in three phase.

Market Data | Mar 22, 2018
Architecture billings continue to hold positive in 2018
Billings particularly strong at firms in the West and Midwest regions.

Market Data | Mar 21, 2018
Construction employment increases in 248 metro areas as new metal tariffs threaten future sector job gains
Riverside-San Bernardino-Ontario, Calif., and Merced, Calif., experience largest year-over-year gains; Baton Rouge, La., and Auburn-Opelika, Ala., have biggest annual declines in construction employment.


