

Is the construction industry in recovery or transition?
That’s the question raised by Rider Levett Bucknall’s North America Quarterly Construction Cost report for the second quarter of 2021.
On the positive side, the major economic indicators showed no signs for concern. Inflation in the first quarter of 2021 rose 1.7% over the previous quarter. The Gross Domestic Project increased by 6.4% in the first quarter of 2021 compared to the same period a year ago. And the index for Architectural Billings, at 55.6 in March, was above the 50 mark for the first time since Q4 2019. (It rose again in April, to 57.9.)
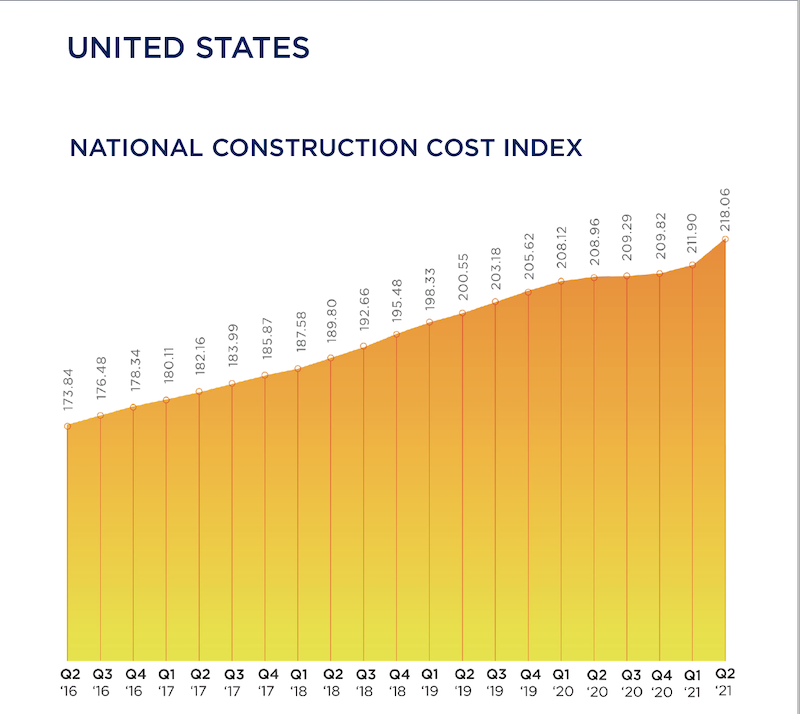
RLB’s Construction Cost Index, at 218.06 for the first quarter of 2021, was 4.6% above the same quarter in 2020. And construction in place in April, as valued by the U.S. Commerce Department, stood at $1.524 trillion, 9.8% higher than in April 2020.
On the glass-half-empty side, the construction industry is still hampered by supply-chain bottlenecks, volatile commodity prices, delayed permitting processes and materials tariffs. The ongoing shortage of qualified labor—construction unemployment, while down in the first quarter, was still 8.6%—is also having an impact on projects’ cost and scheduling, making budgeting and bidding “highly uncertain,” says RLB’s report.
The immediate future isn’t all that clear, either, what with the possibility of climbing interest rates, and the Biden Administration’s prioritizing clean energy and reduced carbon levels in response to climate change, which might also affect construction prices.
SEVERAL METROS EXCEED NATIONAL COST GROWTH AVERAGES
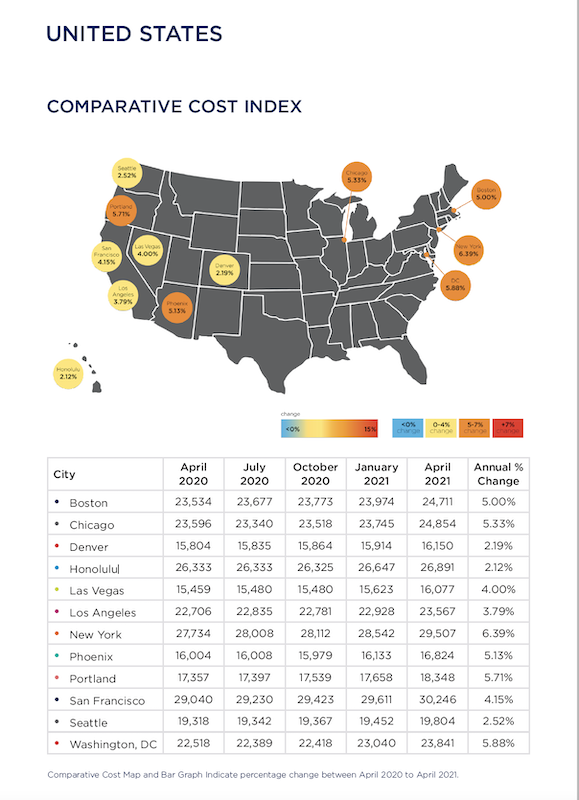
Construction spending was on the rise in all the metros that RLB tracked, several at rates higher than the 4.35% national average for the first quarter.
A closer look at construction costs per square foot found that San Francisco or Honolulu led the pack for hotels, industrial buildings, parking, five-star hotels, residential housing, and elementary education. New York outpaced other cities for new retail, high schools, and universities.
Boston, Chicago, New York, Phoenix, Portland, and Washington, D.C. all experienced percentage increases in construction costs above the 4.35% quarterly national average during Q1 2021 versus the same quarter a year ago. Other locations below the national average included Denver, Honolulu, Los Angeles, San Francisco, and Seattle. Las Vegas experienced the same escalation as the national average.
RLB thinks the most critical choices that GCs and CMs now face is identifying which building sectors to target while operating in a business environment that’s been altered by the coronavirus pandemic. For example, in the first quarter, the industrial sector grew by 12%, year-over-year; conversely hotels and hospitality projects contracted by 9%.
“One of the lessons learned from the past year is the central—and growing—role that technology plays in the AEC industries,” wrote Julian Anderson, FRICS, President of Rider Levett Bucknall North America. “The degree of operational efficiency that connected technologies affords is a true game changer, providing transparency, accuracy, and consistency to all stakeholders while accelerating the design process. From cost estimating to streamlining workflows to digital twins, these tools are transforming the landscape of design and construction.”
Related Stories

Market Data | Jan 29, 2018
Year-end data show economy expanded in 2017; Fixed investment surged in fourth quarter
The economy expanded at an annual rate of 2.6% during the fourth quarter of 2017.

Market Data | Jan 25, 2018
Renters are the majority in 42 U.S. cities
Over the past 10 years, the number of renters has increased by 23 million.

Market Data | Jan 24, 2018
HomeUnion names the most and least affordable rental housing markets
Chicago tops the list as the most affordable U.S. metro, while Oakland, Calif., is the most expensive rental market.

Market Data | Jan 12, 2018
Construction input prices inch down in December, Up YOY despite low inflation
Energy prices have been more volatile lately.

Market Data | Jan 4, 2018
Nonresidential construction spending ticks higher in November, down year-over-year
Despite the month-over-month expansion, nonresidential spending fell 1.3 percent from November 2016.

Contractors | Jan 4, 2018
Construction spending in a ‘mature’ period of incremental growth
Labor shortages are spiking wages. Materials costs are rising, too.
 reported the November ABI score was 55.0, up from a score of 51.7 in the previous month. Photo: Pixabay")
Market Data | Dec 20, 2017
Architecture billings upturn shows broad strength
The American Institute of Architects (AIA) reported the November ABI score was 55.0, up from a score of 51.7 in the previous month.

Market Data | Dec 14, 2017
ABC chief economist predicts stable 2018 construction economy
There are risks to the 2018 outlook as a number of potential cost increases could come into play.

Market Data | Dec 13, 2017
Top world regions and markets in the global hotel construction pipeline
The top world region by project count is North America.

Market Data | Dec 11, 2017
Global hotel construction pipeline is growing
The Total Pipeline stands at 12,427 Projects/2,084,940 Rooms.


