

Design-build delivered projects will account for nearly half of all construction spending by 2025, according to the consulting and investment firm FMI’s latest market research on design-built utilization.
FMI’s research for its 50-page report is based on a survey of 279 industry stakeholders and 46 interviews. FMI conducted the study in partnership with the Design-Build Institute of America (DBIA), and piggybacks on research in 2018 that confirmed design-build was no longer just an alternative delivery method, but one that had been embraced by a growing number of owner-developers and their AEC partners.
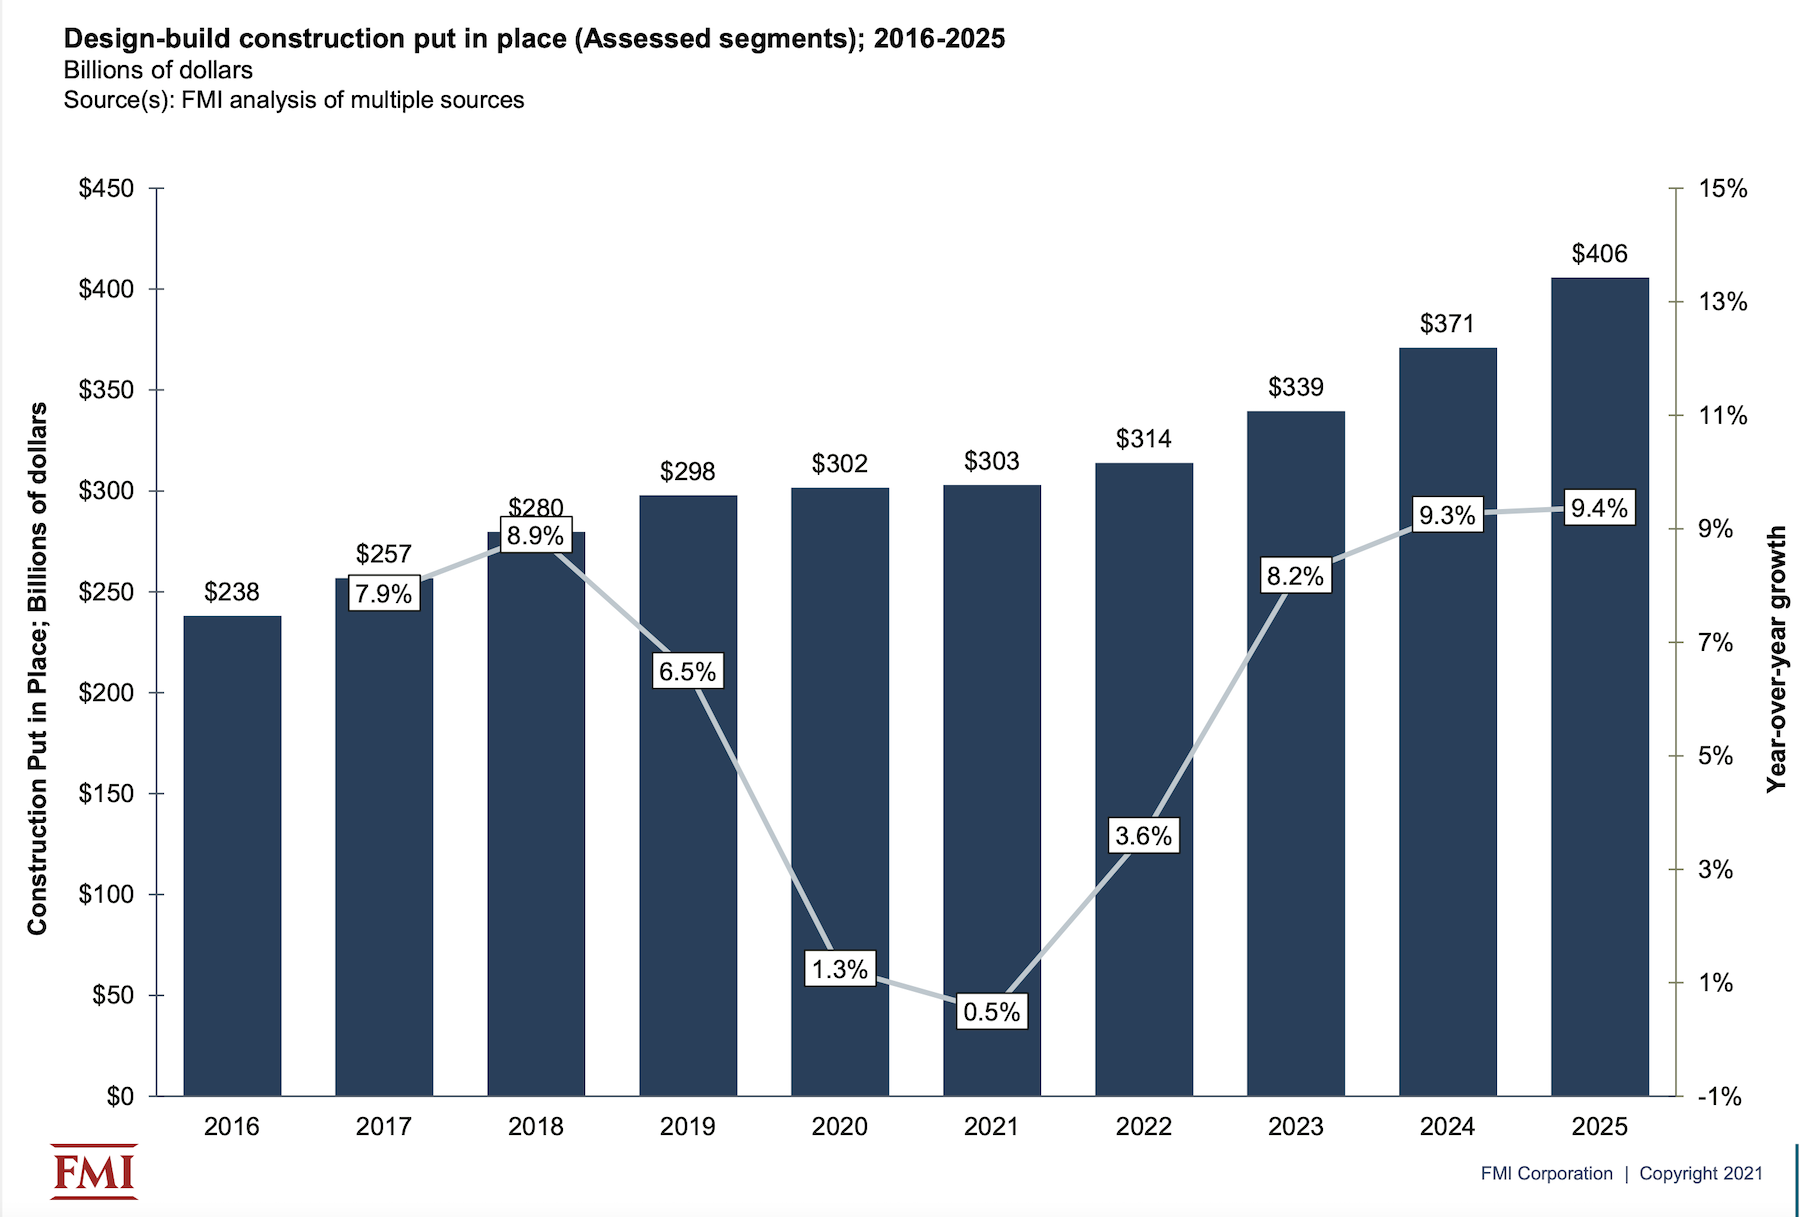
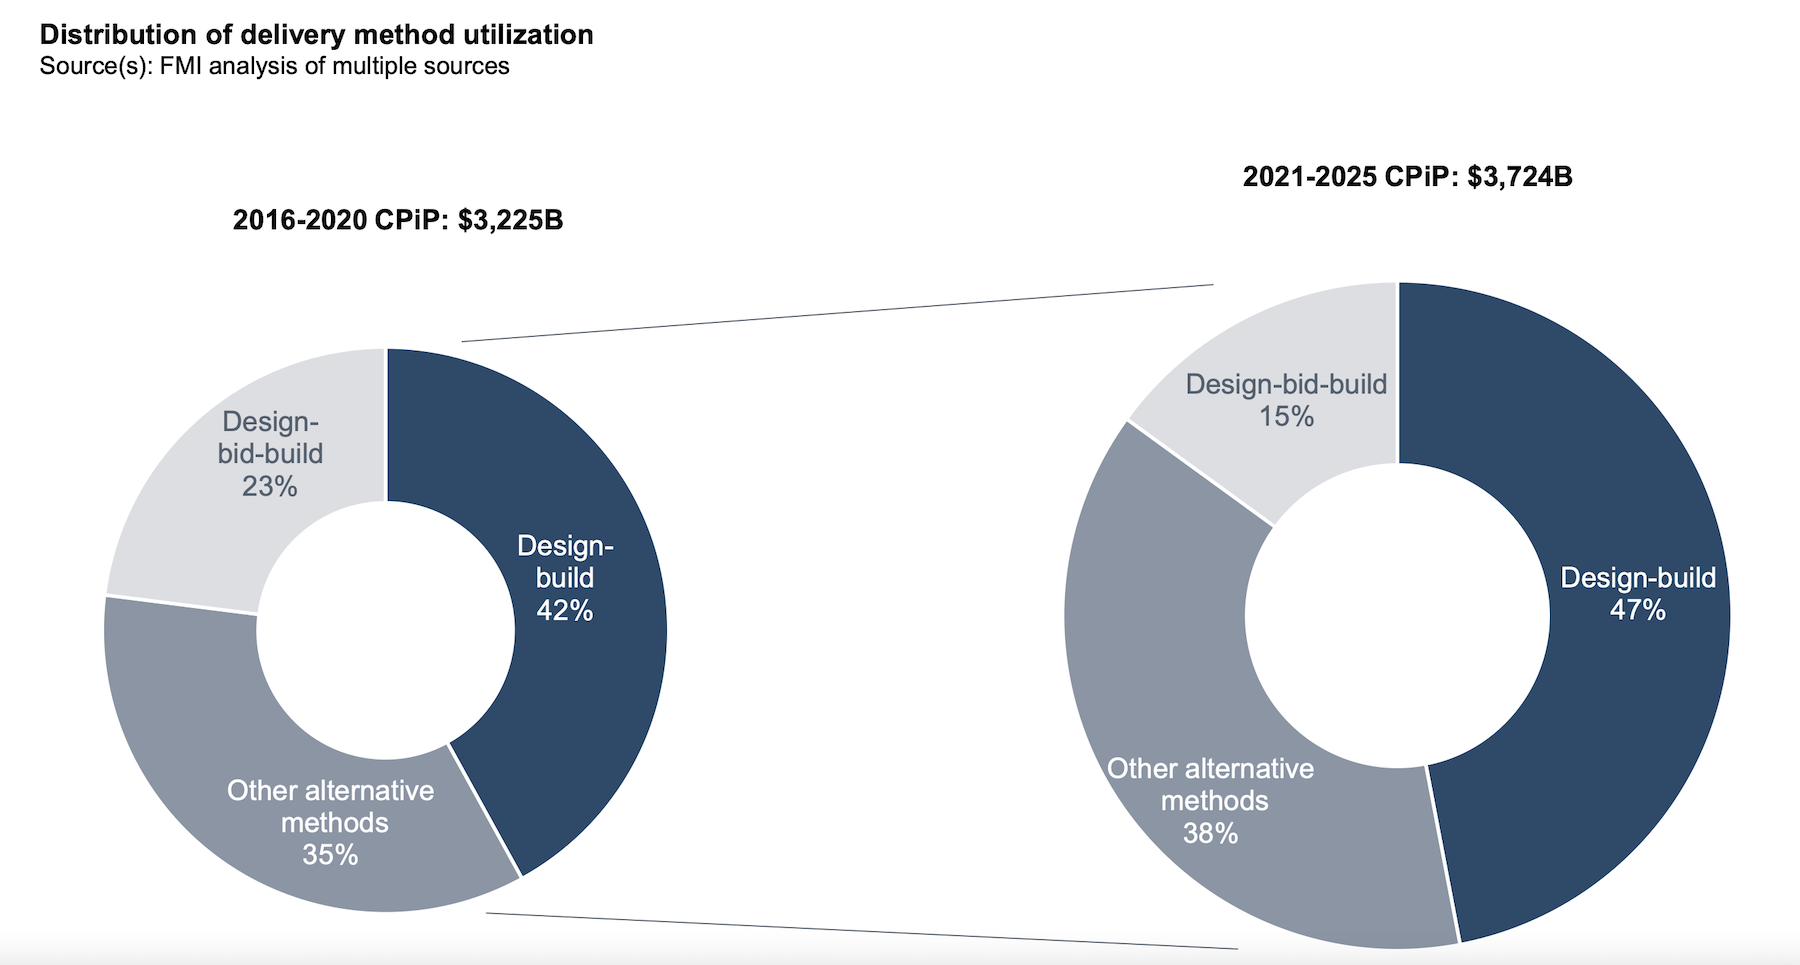
FMI’s latest report, which it releases today, forecasts that spending for design-build construction put in place will grow at a compound annual rate of 7.6% over the years 2021 through 2025, and hit $405.7 billion in 2025, or 47% of total construction spending that year, vs 42% of the total in 2021.
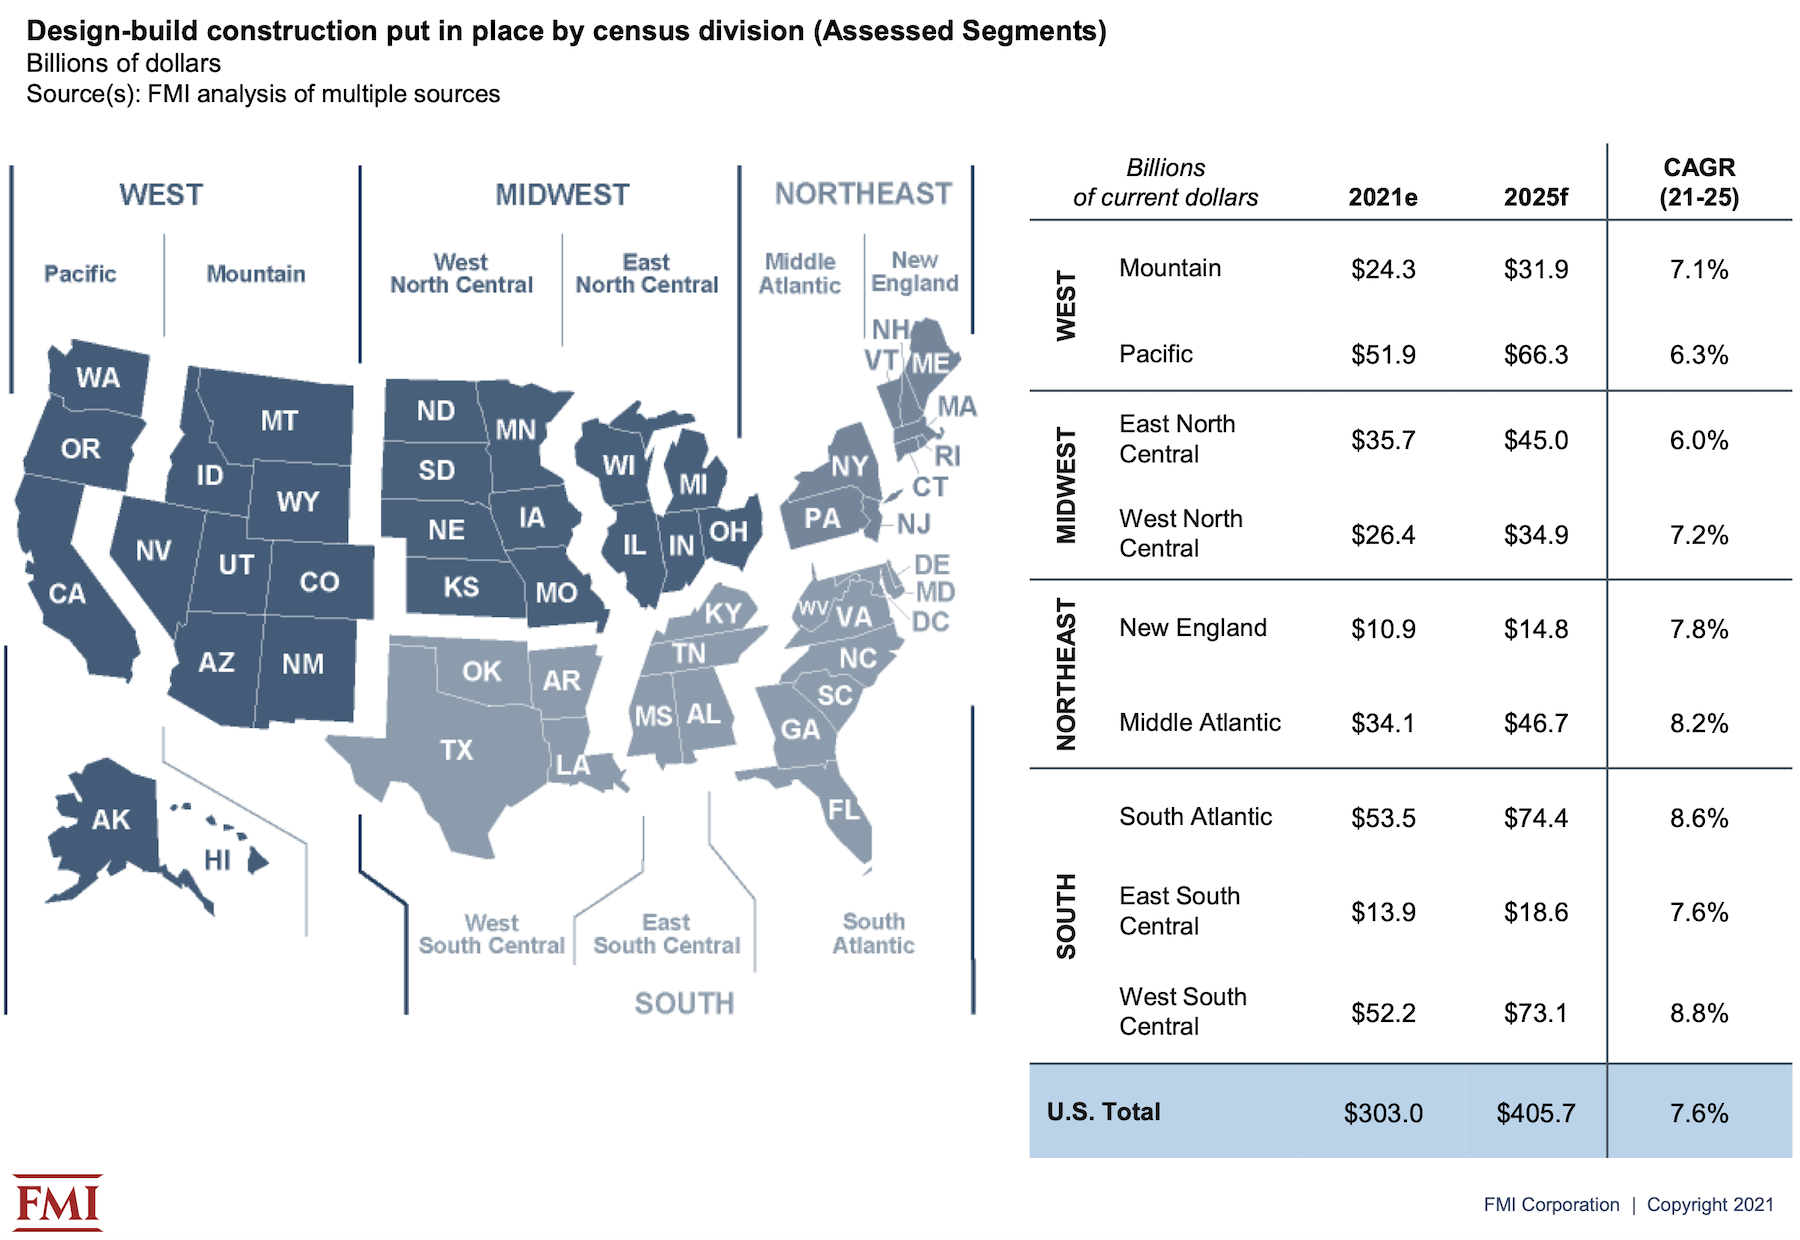
FMI expects the five-year rate of growth to be higher than the national average in the West South Central, South Atlantic, Middle Atlantic, and New England regions.
CERTAIN SECTORS MORE DISPOSED TOWARD DESIGN-BUILD
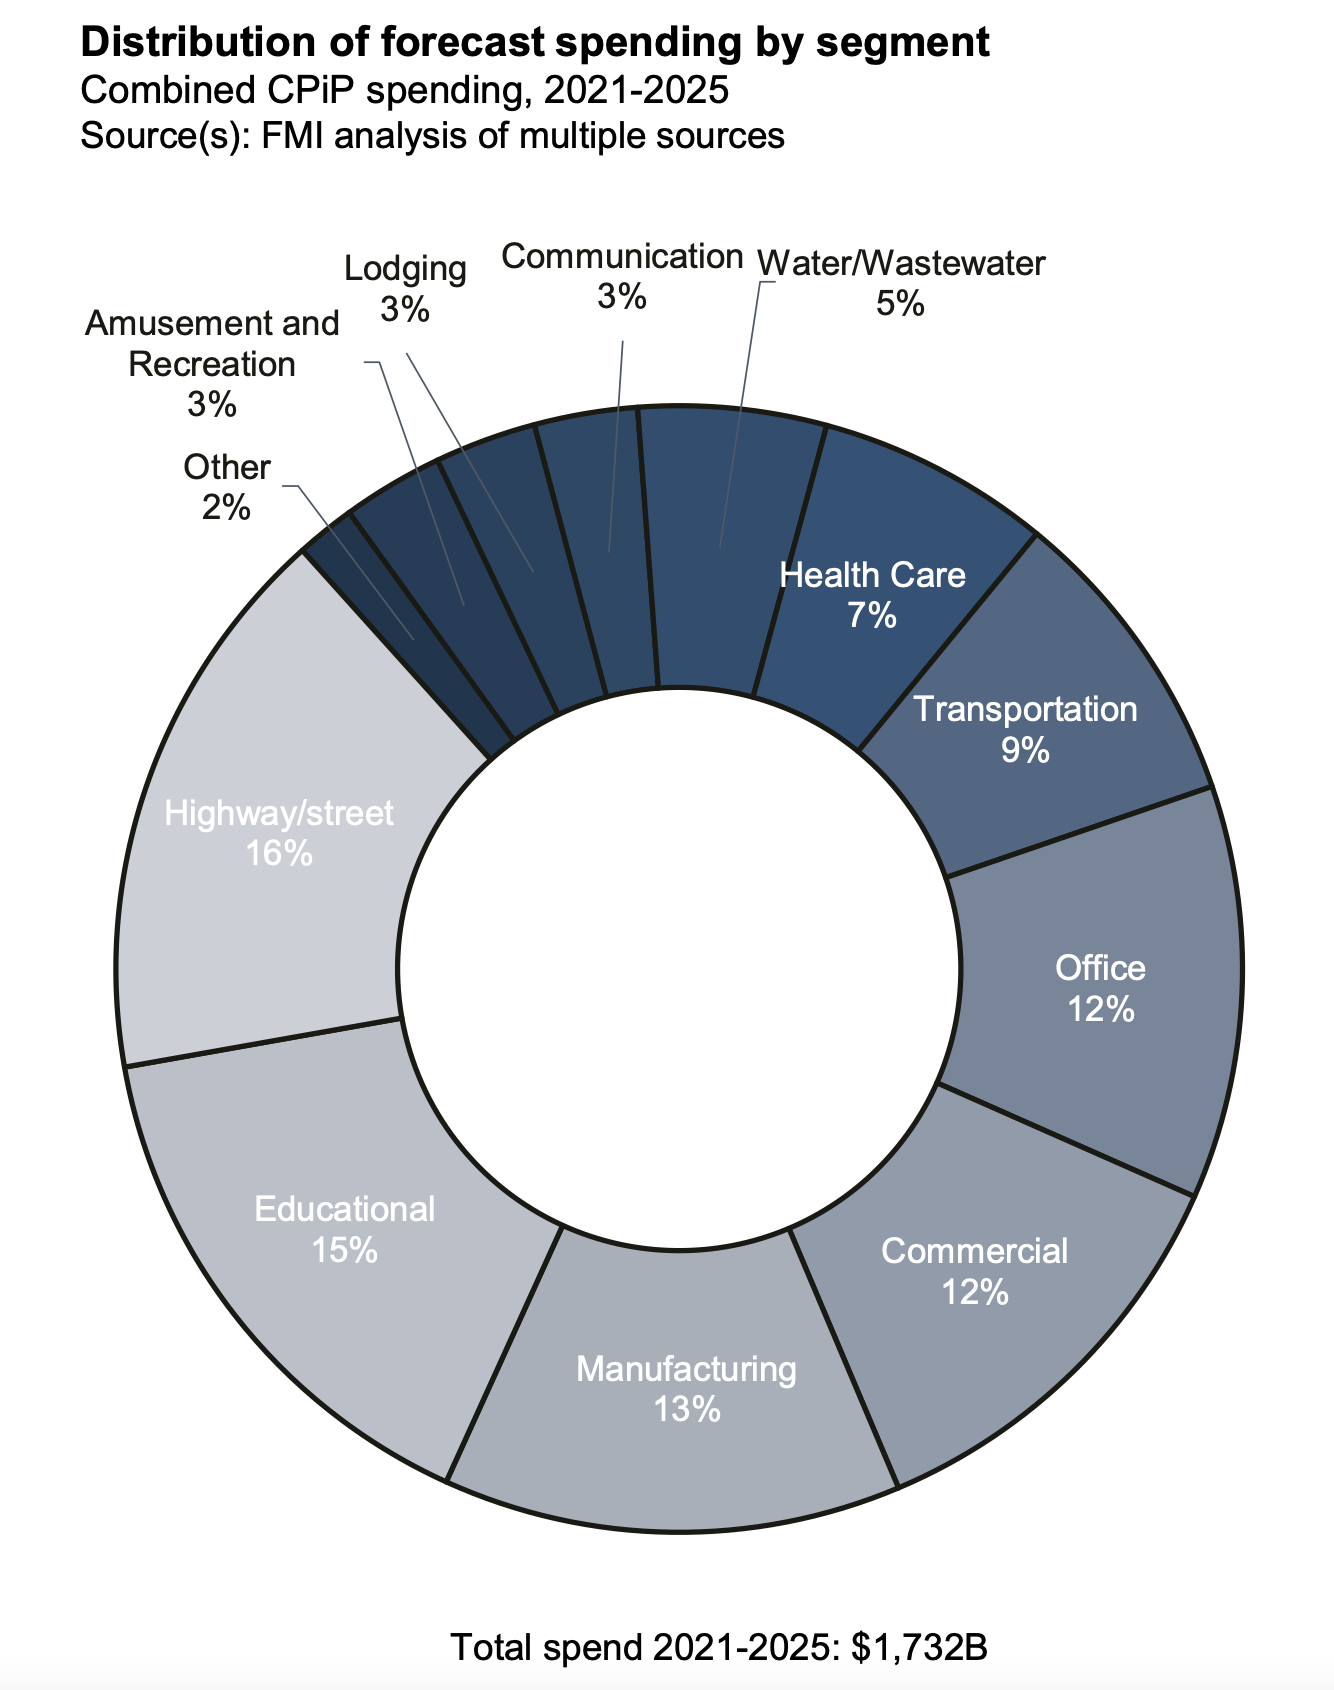
Over the forecast years, FMI estimates that the aggregate spending on projects delivered via design-build will be $1.732 trillion, or 46.2% of the $3.742 trillion spent on all construction projects. Highway and street projects will account for 16% of the design-build spending, followed by Education (15%), Manufacturing (13%) and Commercial and Office (12% each). Spending on design-build water/wastewater projects is expected to show the highest annual growth rate—11.1%—although that sector will represent only 5% of total design-build project spending over the forecast years.
Design-build rated highest across all project delivery methods, with 77% of the report’s respondents having “very good” or “excellent” experiences with the method. The 2021 study found that 60% of respondents identified “owner goals and objectives” as an influence on their choice of delivery methods, following by 50% who identified a project’s complexity and innovation, and 46% who cited “delivery schedule” or “contractor experience.”
HIGH FAVORABILITY QUOTIENT
Seventy-seven percent of the study’s respondents thought that the design-build delivery method would increase over the next five years. “We have seen significantly more design-build work,” stated one respondent quoted in the report. “Virtually everything in our geography is going design-build,” said another.
Conversely, respondents with less favorable experiences with design-build delivery noted that some owners still see this method as a way of transferring risk to the building team, and underestimate the commitment needed to make this delivery method work.
Most respondents, however, saw myriad benefits in design-build. For example, 76% of architects, designers, and engineers, and 89% of GCs and CMs, cited increased collaboration and creativity. Greater project and design control was cited by 88% of GCs/CMs and 84% of specialty trade contractors. GCs/CMs (who represented 31% of the study’s respondents) like the opportunities to innovate that design-build methods afford them, as do 90% of owner’s reps.
Nearly half—47%—of organizations that responded to FMI’s survey use fixed price/lump sum contracts for their design-build projects, compared to 39% that use guaranteed max price contracts.
Related Stories

Market Data | Feb 19, 2019
ABC Construction Backlog Indicator steady in Q4 2018
CBI reached a record high of 9.9 months in the second quarter of 2018 and averaged about 9.1 months throughout all four quarters of last year.

Market Data | Feb 14, 2019
U.S. Green Building Council announces top 10 countries and regions for LEED green building
The list ranks countries and regions in terms of cumulative LEED-certified gross square meters as of December 31, 2018.

Market Data | Feb 13, 2019
Increasingly tech-enabled construction industry powers forward despite volatility
Construction industry momentum to carry through first half of 2019.

Market Data | Feb 4, 2019
U.S. Green Building Council announces annual Top 10 States for LEED Green Building in 2018
Illinois takes the top spot as USGBC defines the next generation of green building with LEED v4.1.

Market Data | Feb 4, 2019
Nonresidential construction spending dips in November
Total nonresidential spending stood at $751.5 billion on a seasonally adjusted annualized rate.

Market Data | Feb 1, 2019
The year-end U.S. hotel construction pipeline continues steady growth trend
Project counts in the early planning stage continue to rise reaching an all-time high of 1,723 projects/199,326 rooms.

Market Data | Feb 1, 2019
Construction spending is projected to increase by more than 11% through 2022
FMI’s annual outlook also expects the industry’s frantic M&A activity to be leavened by caution going forward.

Market Data | Jan 23, 2019
Architecture billings slow, but close 2018 with growing demand
AIA’s Architecture Billings Index (ABI) score for December was 50.4 compared to 54.7 in November.

Market Data | Jan 16, 2019
AIA 2019 Consensus Forecast: Nonresidential construction spending to rise 4.4%
The education, public safety, and office sectors will lead the growth areas this year, but AIA's Kermit Baker offers a cautious outlook for 2020.

Market Data | Dec 19, 2018
Brokers look forward to a commercial real estate market that mirrors 2018’s solid results
Respondents to a recent Transwestern poll expect flat to modest growth for rents and investment in offices, MOBs, and industrial buildings.


