


Architecture firms continue to report increasing demand for design services in September, according to a new report today from The American Institute of Architects (AIA).
The Architecture Billings Index (ABI) score for September was 56.6, which is up from August’s score of 55.6. Any score above 50 indicates an increase in billings from the prior month. During September, scoring for both the new project inquiries and design contracts moderated slightly, but remained in positive territory, posting scores of 61.8 and 54.7 respectively.
“The ABI scores over the last eight months continue to be among the highest ever seen in the immediate post-recession periods that have been captured throughout the index’s history,” said AIA Chief Economist, Kermit Baker, Hon. AIA, PhD. “However, it’s unlikely that revenue increases at architecture firms can sustain this pace. Given that growth in both new design contracts and project inquiries have moderated in recent months, we expect to see a similar path for the ABI.”
Key ABI highlights for September include:
• Regional averages: Midwest (57.7); South (57.0); West (56.0); Northeast (51.5)
• Sector index breakdown: mixed practice (58.8); commercial/industrial (58.1); multi-family residential (56.1); institutional (53.5)
The regional and sector categories are calculated as a three-month moving average, whereas the national index, design contracts and inquiries are monthly numbers.
Visit AIA’s website for more ABI information.
Related Stories
Market Data | Jul 18, 2019
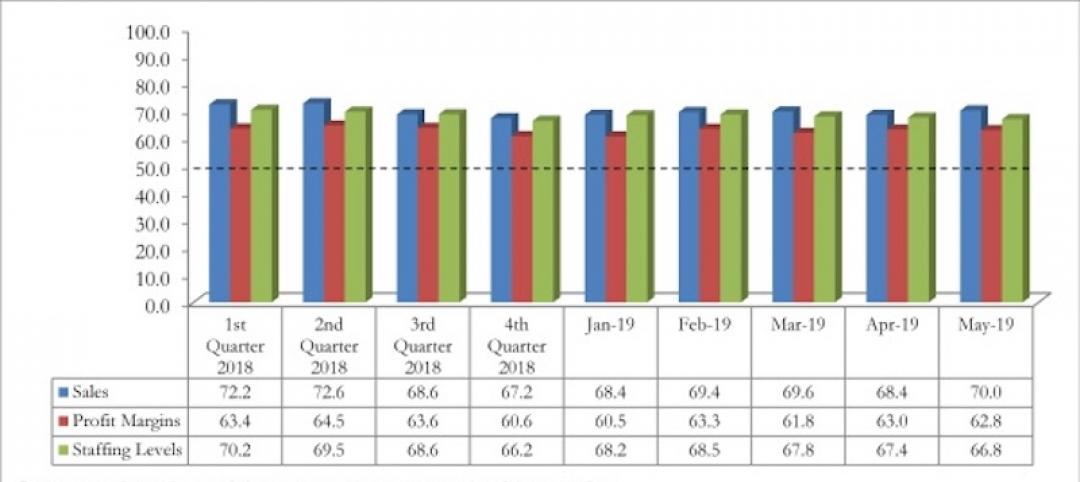
Construction contractors remain confident as summer begins
Contractors were slightly less upbeat regarding profit margins and staffing levels compared to April.
Market Data | Jul 17, 2019
Design services demand stalled in June
Project inquiry gains hit a 10-year low.
Market Data | Jul 16, 2019
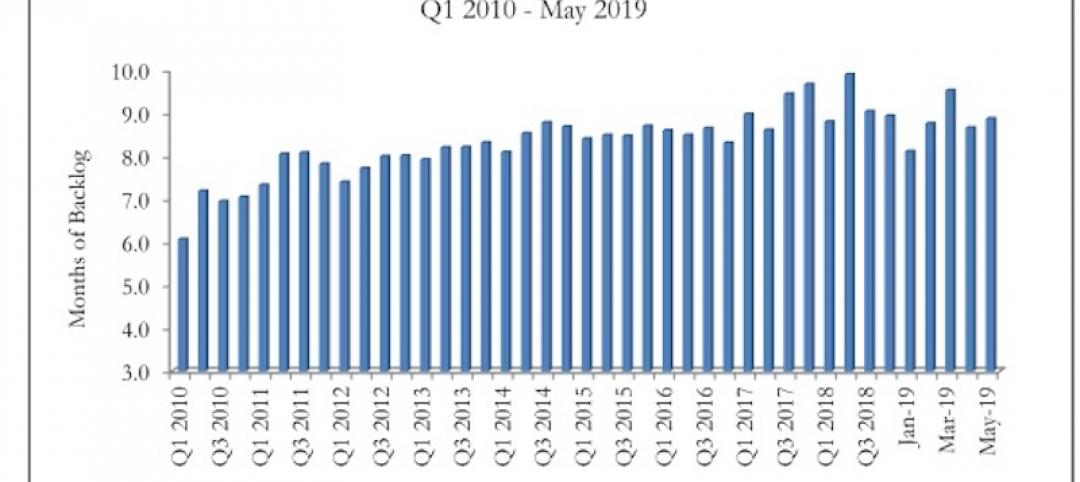
ABC’s Construction Backlog Indicator increases modestly in May
The Construction Backlog Indicator expanded to 8.9 months in May 2019.

K-12 Schools | Jul 15, 2019
Summer assignments: 2019 K-12 school construction costs
Using RSMeans data from Gordian, here are the most recent costs per square foot for K-12 school buildings in 10 cities across the U.S.
Market Data | Jul 12, 2019
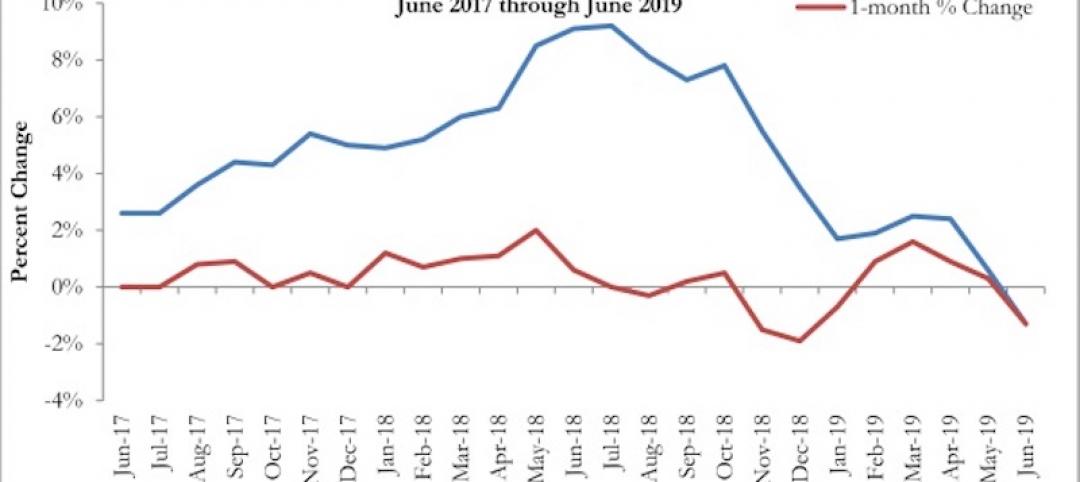
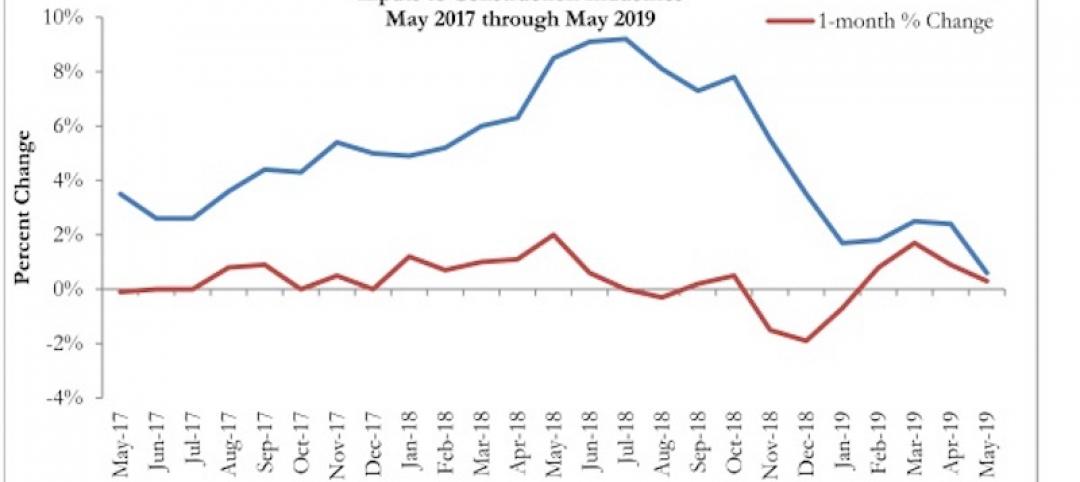
Construction input prices plummet in June
This is the first time in nearly three years that input prices have fallen on a year-over-year basis.
Market Data | Jul 1, 2019
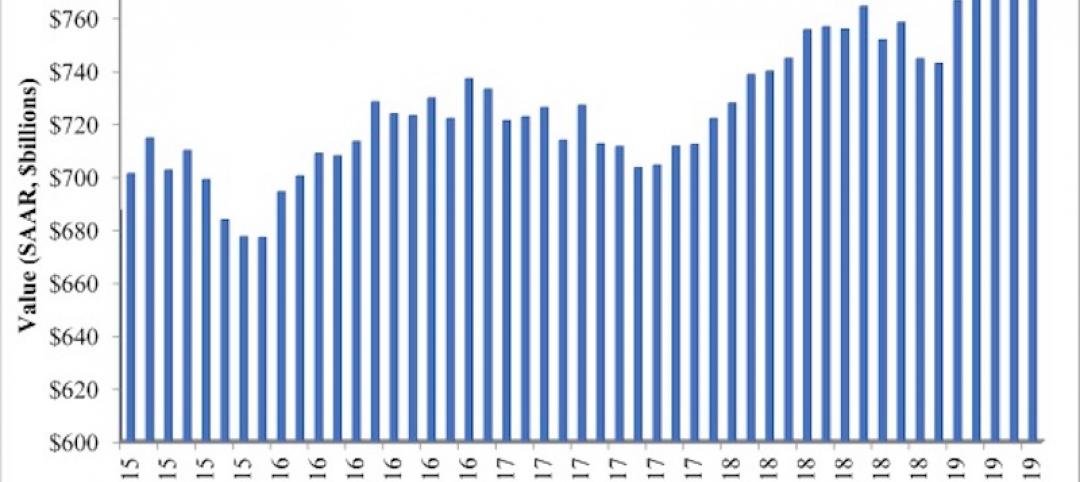
Nonresidential construction spending slips modestly in May
Among the 16 nonresidential construction spending categories tracked by the Census Bureau, five experienced increases in monthly spending.

Market Data | Jul 1, 2019
Almost 60% of the U.S. construction project pipeline value is concentrated in 10 major states
With a total of 1,302 projects worth $524.6 billion, California has both the largest number and value of projects in the U.S. construction project pipeline.
Market Data | Jun 21, 2019
Architecture billings remain flat
AIA’s Architecture Billings Index (ABI) score for May showed a small increase in design services at 50.2.

Market Data | Jun 19, 2019
Number of U.S. architects continues to rise
New data from NCARB reveals that the number of architects continues to increase.
Market Data | Jun 12, 2019
Construction input prices see slight increase in May
Among the 11 subcategories, six saw prices fall last month, with the largest decreases in natural gas.


