


The Architecture Billings Index (ABI) recorded its sixth consecutive positive month, according to a new report today from The American Institute of Architects (AIA).
The ABI score for July was 54.6. While this was down slightly from June’s score of 57.1, it still indicates very strong business conditions overall (any score above 50 indicates an increase in billings from the prior month). Scoring for new project inquiries also declined in July but remained near its all-time high at 65.0. The score for new design contracts was essentially unchanged from June to July with a score of 58.0.
“In prior business cycles, architecture firms generally saw their project work soften quickly and then recover slowly,” said AIA Chief Economist, Kermit Baker, Hon. AIA, PhD. “So the strength of this recovery is unprecedented. Firm leaders who have leaned into this economic upturn by reinvesting in their firms by hiring staff and upgrading their technology, will likely have a better year than those that anticipated a slower recovery.”
Key ABI highlights for July include:
- Regional averages: Midwest (58.3); West (56.0); South (54.6); Northeast (54.1)
- Sector index breakdown: commercial/industrial (58.4); institutional (55.4); multi-family residential (54.7); mixed practice (54.4)
The regional and sector categories are calculated as a three-month moving average, whereas the national index, design contracts and inquiries are monthly numbers.
To learn more about recent economic developments impacting design and construction, visit AIA’s website.
Related Stories

Market Data | Nov 22, 2021
Only 16 states and D.C. added construction jobs since the pandemic began
Texas, Wyoming have worst job losses since February 2020, while Utah, South Dakota add the most.
Market Data | Nov 10, 2021
Construction input prices see largest monthly increase since June
Construction input prices are 21.1% higher than in October 2020.
Market Data | Nov 9, 2021
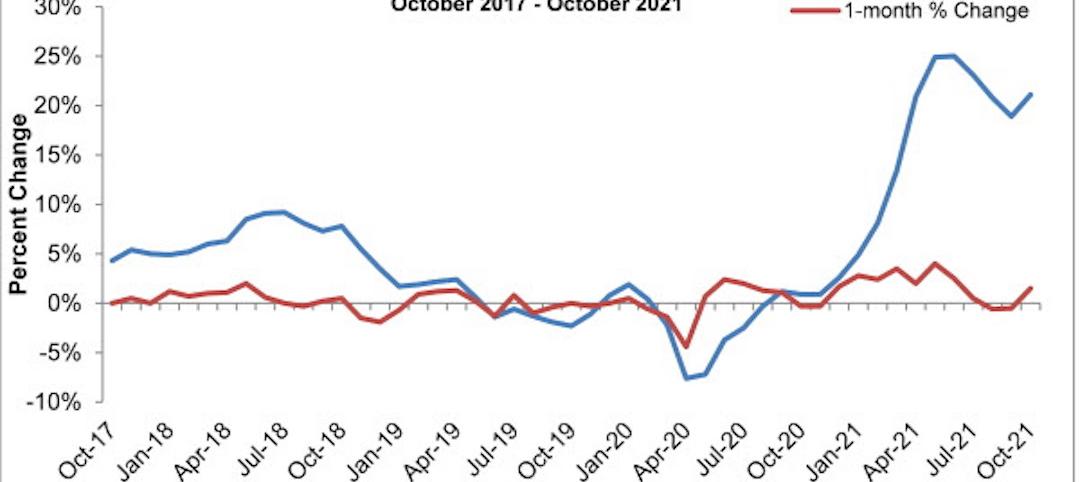
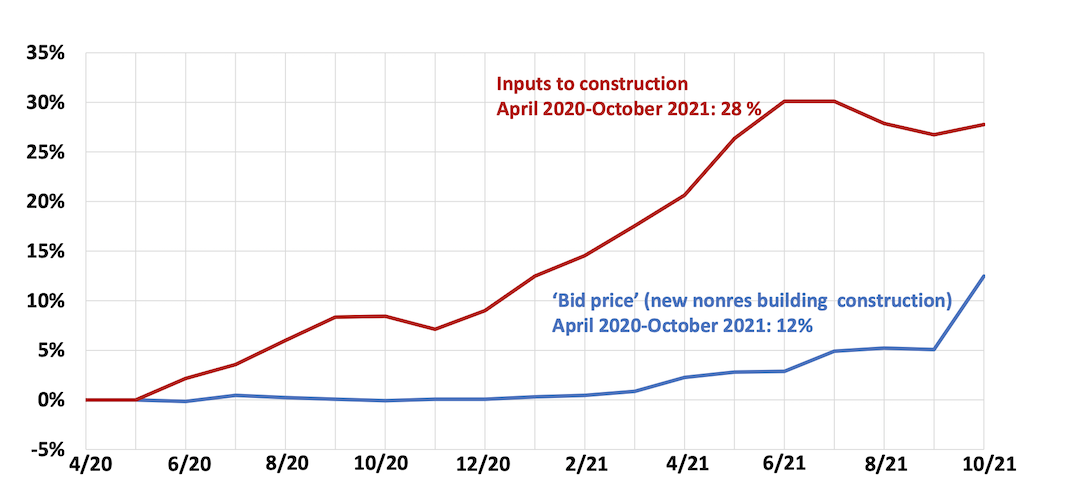
Continued increases in construction materials prices starting to drive up price of construction projects
Supply chain and labor woes continue.
Market Data | Nov 5, 2021
Construction firms add 44,000 jobs in October
Gain occurs even as firms struggle with supply chain challenges.
Market Data | Nov 3, 2021
One-fifth of metro areas lost construction jobs between September 2020 and 2021
Beaumont-Port Arthur, Texas and Sacramento--Roseville--Arden-Arcade Calif. top lists of gainers.
Market Data | Nov 2, 2021
Construction spending slumps in September
A drop in residential work projects adds to ongoing downturn in private and public nonresidential.

Hotel Facilities | Oct 28, 2021
Marriott leads with the largest U.S. hotel construction pipeline at Q3 2021 close
In the third quarter alone, Marriott opened 60 new hotels/7,882 rooms accounting for 30% of all new hotel rooms that opened in the U.S.

Hotel Facilities | Oct 28, 2021
At the end of Q3 2021, Dallas tops the U.S. hotel construction pipeline
The top 25 U.S. markets account for 33% of all pipeline projects and 37% of all rooms in the U.S. hotel construction pipeline.
Market Data | Oct 27, 2021
Only 14 states and D.C. added construction jobs since the pandemic began
Supply problems, lack of infrastructure bill undermine recovery.

Market Data | Oct 26, 2021
U.S. construction pipeline experiences highs and lows in the third quarter
Renovation and conversion pipeline activity remains steady at the end of Q3 ‘21, with conversion projects hitting a cyclical peak, and ending the quarter at 752 projects/79,024 rooms.


