

Thirty-nine states lost construction jobs between August 2019 and August 2020 while 31 states and the District of Columbia added construction jobs between July and August according to a new analysis of Labor Department data released today by the Associated General Contractors of America. The new annual figures detail how the coronavirus pandemic has undermined demand for construction projects after a strong start to the year.
“The ongoing pandemic is prompting ever more private owners, developers, and public agencies to delay and cancel projects,” said Ken Simonson, the association’s chief economist, citing the association’s mid-June survey and a more recent survey it produced in August. “The share of contractors that reported postponed or canceled projects nearly doubled while the share who reported winning new or expanded work dropped nearly in half.”
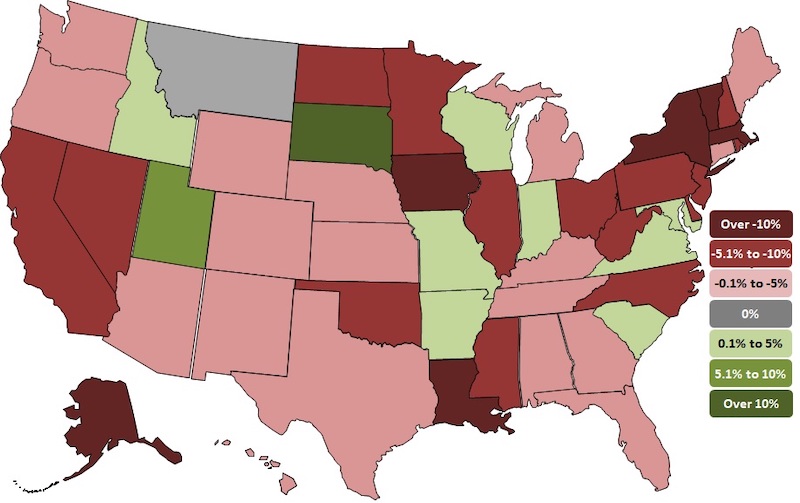
California lost the most construction jobs (-52,000, -5.8%) between August 2019 and August 2020, followed by New York (-46,000, -11.3%); Texas (-39,300 jobs, -5.0%); Massachusetts (-20,200 jobs, -12.4%) and Illinois (-17,200 jobs, -7.5%). Vermont lost the highest percent of construction jobs for the year (-29.6%, -4,500 jobs), followed by Massachusetts; Iowa (-11.8%, -9,300 jobs); Louisiana (-11.4%, -15,700 jobs) and New York.
Ten states and the District of Columbia added construction jobs between August 2019 and August 2020 while construction employment was unchanged in Montana. Utah added the most new construction jobs (8,800 jobs, 8.0%), followed by Virginia (4,400 jobs, 2.2%); Maryland (3,800 jobs, 2.3%); Indiana (3,100 jobs, 2.1%) and Missouri (2,700 jobs, 2.1%). South Dakota added the highest percent (10.9%, 2,600 jobs), followed by Utah; Idaho (2.4%, 1,300 jobs); Maryland and Virginia.
California added the most new construction jobs (6,700 jobs, 0.8%) between July and August, followed by New York (5,200 jobs, 1.5%); Pennsylvania (4,100 jobs, 1.7%); Texas (3,300 jobs, 0.4%) and Oregon (3,200 jobs, 3.1%). New Mexico added the highest percentage (6.7%, 3,100) of jobs for the month, followed by Mississippi (3.4%, 1,400 jobs); Oregon and Kentucky (2.0%, 1,600 jobs).
Nineteen states lost construction jobs for the month with Nevada losing the most (-2,600 jobs, -2.8%). Other states losing a high number of construction jobs for the month include Florida (-2,200 jobs, -0.4%); Nebraska (-1,800 jobs, -3.3%) and North Carolina (-1,800 jobs, -0.8%). Hawaii lost the highest percentage (-3.5%, -1,300 jobs) of construction jobs for the month, followed by West Virginia (-3.3%, -1,100 jobs); Nebraska and Nevada.
Association officials said the best thing Washington leaders can do to boost demand for construction and employment in the sector is to increase investments in infrastructure and provide liability protections for firms taking steps to protect workers from the coronavirus. They added that extending the current surface transportation bill for one-year – which appears likely to occur – will provide needed short-term certainty for the transportation construction market.
“The best way to create jobs and boost economic activity is to rebuild aging infrastructure, provide market certainty and protect firms from needless suits,” said Stephen E. Sandherr, the association’s chief executive officer.
View state employment data, 12-mo, 1-mo rankings, map and high and lows. View the workforce survey results.
Related Stories

Market Data | Mar 29, 2017
Contractor confidence ends 2016 down but still in positive territory
Although all three diffusion indices in the survey fell by more than five points they remain well above the threshold of 50, which signals that construction activity will continue to be one of the few significant drivers of economic growth.

Market Data | Mar 24, 2017
These are the most and least innovative states for 2017
Connecticut, Virginia, and Maryland are all in the top 10 most innovative states, but none of them were able to claim the number one spot.

Market Data | Mar 22, 2017
After a strong year, construction industry anxious about Washington’s proposed policy shifts
Impacts on labor and materials costs at issue, according to latest JLL report.

Market Data | Mar 22, 2017
Architecture Billings Index rebounds into positive territory
Business conditions projected to solidify moving into the spring and summer.

Market Data | Mar 15, 2017
ABC's Construction Backlog Indicator fell to end 2016
Contractors in each segment surveyed all saw lower backlog during the fourth quarter, with firms in the heavy industrial segment experiencing the largest drop.

Market Data | Feb 28, 2017
Leopardo’s 2017 Construction Economics Report shows year-over-year construction spending increase of 4.2%
The pace of growth was slower than in 2015, however.

Market Data | Feb 23, 2017
Entering 2017, architecture billings slip modestly
Despite minor slowdown in overall billings, commercial/ industrial and institutional sectors post strongest gains in over 12 months.

Market Data | Feb 16, 2017
How does your hospital stack up? Grumman/Butkus Associates 2016 Hospital Benchmarking Survey
Report examines electricity, fossil fuel, water/sewer, and carbon footprint.

Market Data | Feb 1, 2017
Nonresidential spending falters slightly to end 2016
Nonresidential spending decreased from $713.1 billion in November to $708.2 billion in December.

Market Data | Jan 31, 2017
AIA foresees nonres building spending increasing, but at a slower pace than in 2016
Expects another double-digit growth year for office construction, but a more modest uptick for health-related building.


