

The resolution of global construction disputes remained steady in 2016, and the average time it took to resolve those disputes declined bit, according to the seventh annual Arcadis Global Construction Disputes Report 2017, which is subtitled “Avoiding the Same Pitfalls.”
This report reflects the construction disputes that Arcadis’ team handled around the world. The report infers that the roadblocks to expeditious and less cost dispute resolution often stem from the need for better contract administration, robust documentation, and a proactive approach to risk management.
“Our industry contains the best problem solvers in the world,” the report states. “But there often seems to be a lack of ability or willingness of the project participants to compromise and resolve disputes at the earliest and most inexpensive stage possible.” Roy Cooper, Senior Vice President of Arcadis Contract Solutions, attributes disputes to “human emotions that can impede settlements, as they do with physical factors such as differing site conditions and design errors.”
The world’s economic expansion generally is not seen as an impediment to resolving contract disputes. Global growth is projected at 3.5% in 2017, and 3.6% in 2018, according to the International Monetary Fund.
While the outlook is positive, the report sees risks in labor contraction, increasing commodities prices, and uncertain immigration policies. “A potential widening of global imbalances, coupled with sharp currency exchange rate movements, should those occur in response to major policy shifts, could further intensify protectionist pressures.”
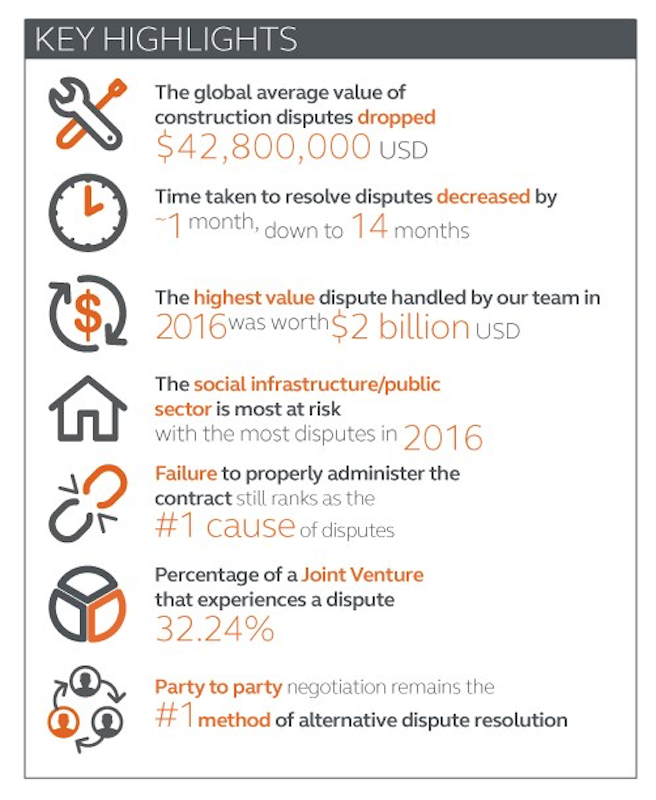
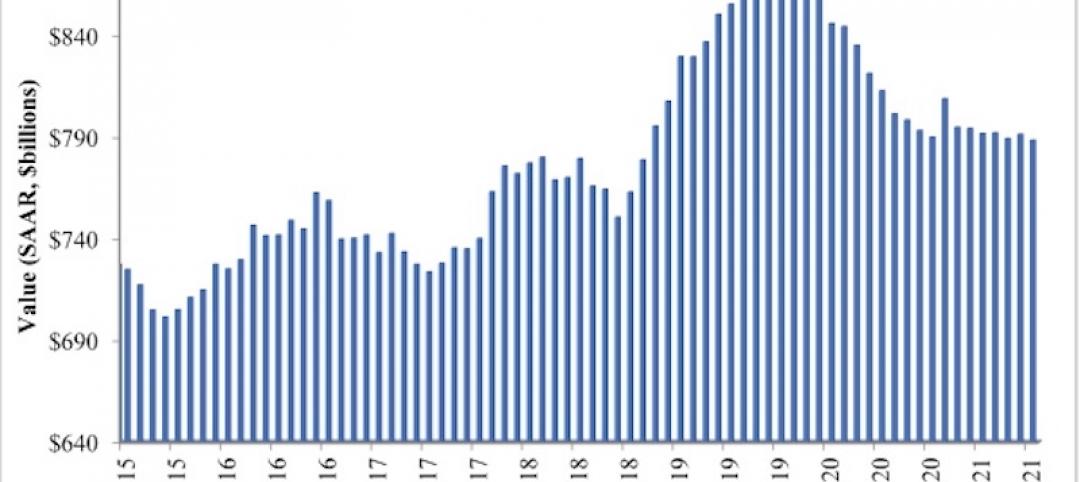
A summary of Arcadis' findings for 2016. Image: Arcadis US
That being said, the global average construction dispute value declined in 2016 by nearly 7% to US$42.8 million (and that includes one US$2 billion dispute Arcadis handled). Asia averaged the highest dispute value, at US$84 million, and the United Kingdom saw a double-digit increase in its average dispute value, to US$34 million.
The global average length of a dispute also fell slightly last year, to 14 months. North America’s dispute duration was the longest of all Arcadis’ regions, an average of 15.6 months. For the third consecutive year, the most common cause for disputes in North America in 2016 was errors and/or omissions in the contract documentation.
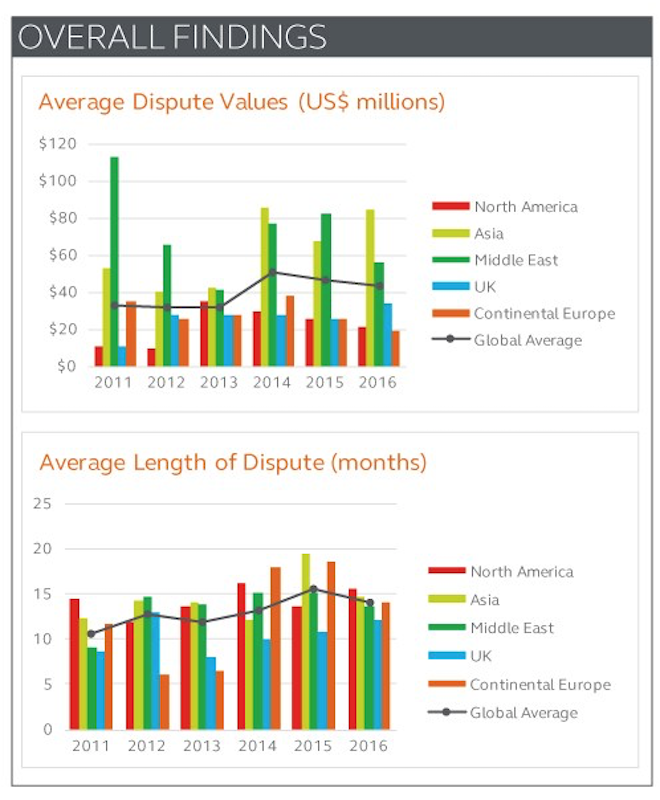
Asia had the highest average dispute value last year; North America the longest time it took to resolve a dispute. Image: Arcadis
Globally, Arcadis identifies failure to properly administer a contract among the five most common causes of disputes, along with poorly drafted or incomplete/unsubstantiated claims; the failure of an employer, contractor or subcontractor to understand or comply with its contractual obligations; errors and omissions in the contract; and incomplete design information or employer requires.
The most common methods to resolve construction disputes were, in order of preference, party-to-party negotiation, arbitration, and mediation.
And the most important activities to avoid disputes were led by proper contract administration, accurate documents, and fair and appropriate risk and balances in contracts.
Related Stories
Market Data | Oct 27, 2021
Only 14 states and D.C. added construction jobs since the pandemic began
Supply problems, lack of infrastructure bill undermine recovery.

Market Data | Oct 26, 2021
U.S. construction pipeline experiences highs and lows in the third quarter
Renovation and conversion pipeline activity remains steady at the end of Q3 ‘21, with conversion projects hitting a cyclical peak, and ending the quarter at 752 projects/79,024 rooms.

Market Data | Oct 19, 2021
Demand for design services continues to increase
The Architecture Billings Index (ABI) score for September was 56.6.
Market Data | Oct 14, 2021
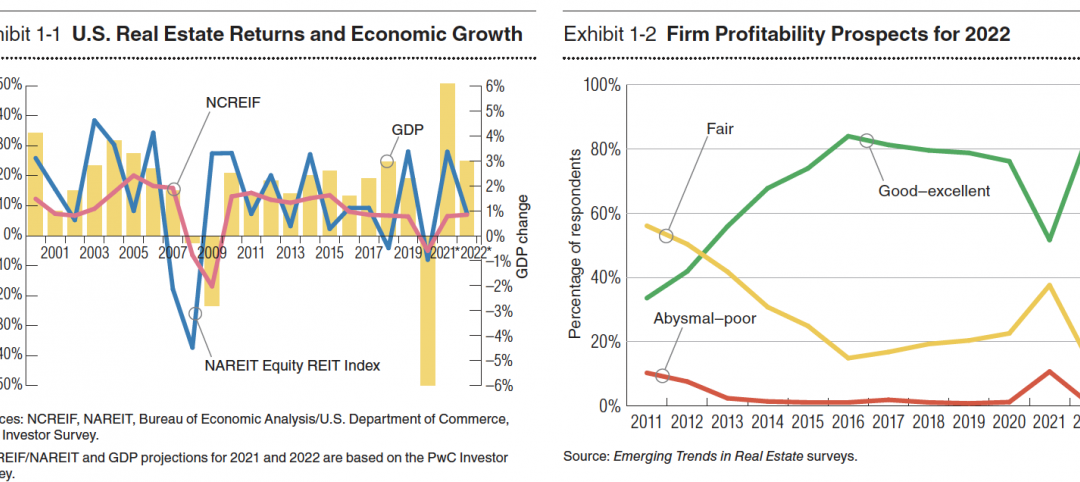
Climate-related risk could be a major headwind for real estate investment
A new trends report from PwC and ULI picks Nashville as the top metro for CRE prospects.
Market Data | Oct 14, 2021
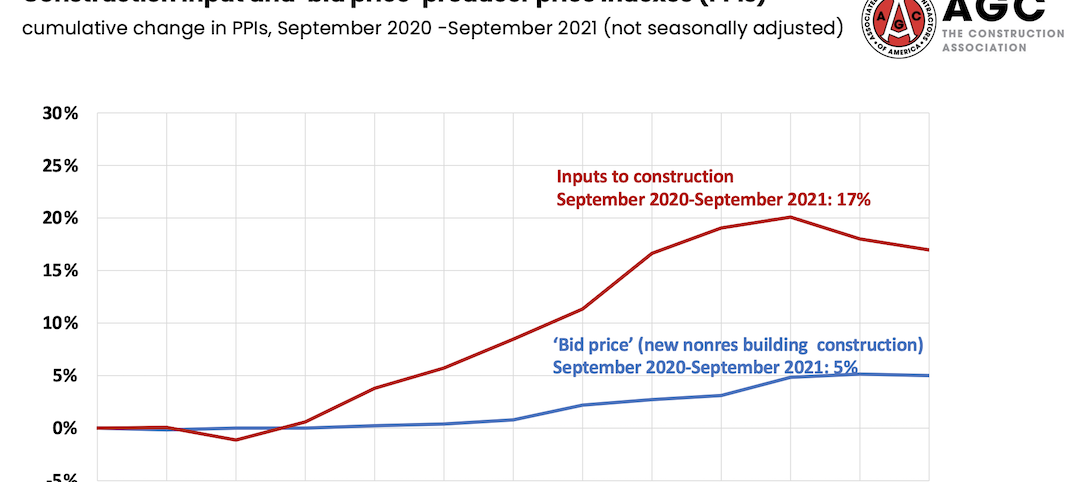
Prices for construction materials continue to outstrip bid prices over 12 months
Construction officials renew push for immediate removal of tariffs on key construction materials.
Market Data | Oct 11, 2021
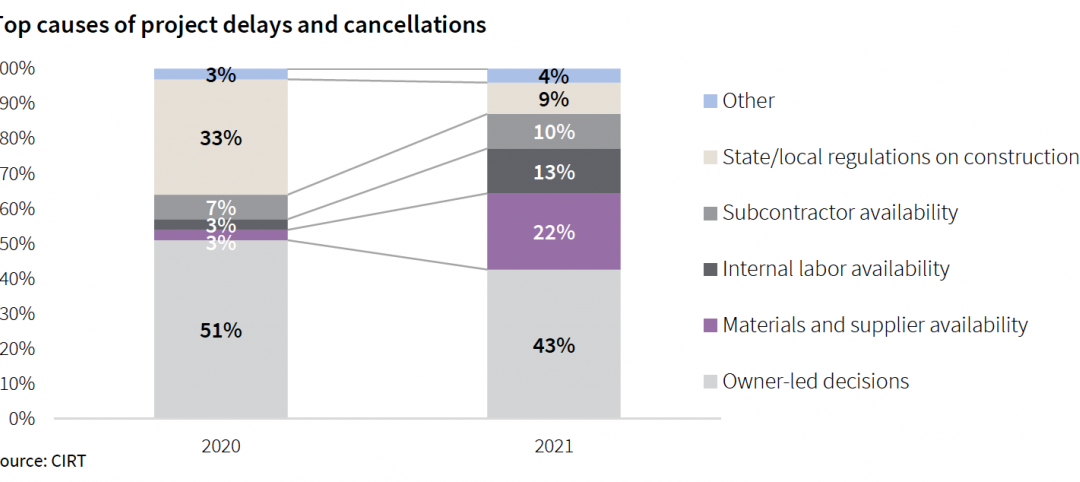
No decline in construction costs in sight
Construction cost gains are occurring at a time when nonresidential construction spending was down by 9.5 percent for the 12 months through July 2021.
Market Data | Oct 11, 2021
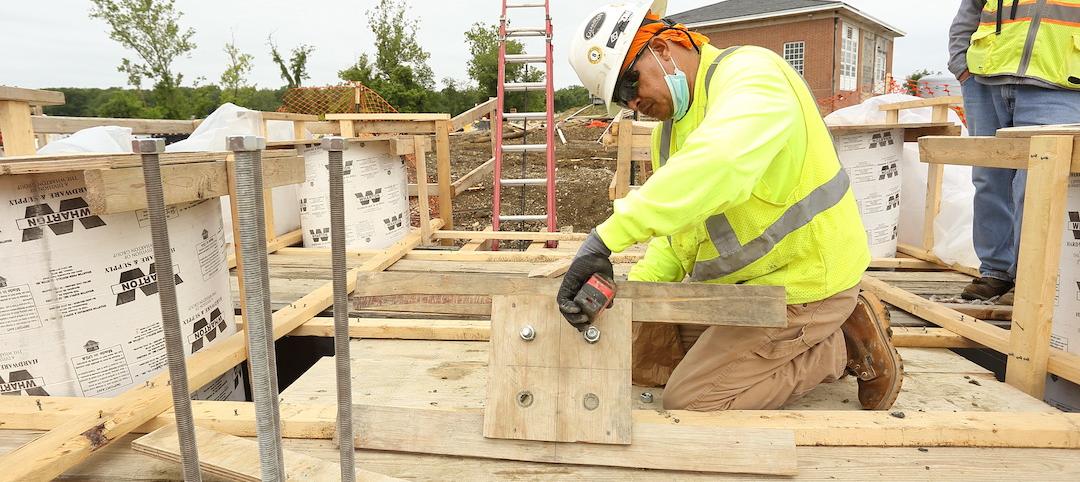
Nonresidential construction sector posts first job gain since March
Has yet to hit pre-pandemic levels amid supply chain disruptions and delays.
Market Data | Oct 4, 2021
Construction spending stalls between July and August
A decrease in nonresidential projects negates ongoing growth in residential work.
Market Data | Oct 1, 2021
Nonresidential construction spending dips in August
Spending declined on a monthly basis in 10 of the 16 nonresidential subcategories.
Market Data | Sep 29, 2021
One-third of metro areas lost construction jobs between August 2020 and 2021
Lawrence-Methuen Town-Salem, Mass. and San Diego-Carlsbad, Calif. top lists of metros with year-over-year employment increases.


